

")
Norway is an important supplier of oil and gas to the global market, and almost all oil and gas produced on the Norwegian shelf is exported. Company and government revenues from the sale of oil and gas have played a crucial role in creating the modern Norwegian society.
All licensees on the Norwegian shelf are responsible for selling the oil and gas they produce. The only exception is Equinor, which in addition is responsible for selling the government share of its oil and gas production (the SDFI share). This responsibility is set out in governmental instructions to Equinor.
Oil is a global commodity that is sold and delivered to most parts of the world. In contrast, there have historically been geographically separate regional gas markets. Gas markets have become more globalised as production and trade with liquefied natural gas (LNG) increase. About 95 % of Norwegian gas is transported via an extensive network of subsea pipelines to other European countries, while about 5 % is exported as LNG by ship from the Melkøya facility in Hammerfest.
The production from different reservoirs (the well stream) contains oil, gas and water in various combinations. To get marketable products, the production from the reservoirs must be separated and treated. The production from different reservoirs varies from oil with low gas content to almost dry gas (methane with only small amounts of other gases).
Crude oil is a fluid that is a combination of different types of hydrocarbons. The composition varies from field to field. The quality of the oil depends on several factors, for example how much and which substances, such as wax and sulphur, it contains. The composition also determines how light or heavy (viscous) the oil is.
Rich gas, or crude natural gas, is a mixture of various gases. When necessary, the gas is separated from the oil before the rich gas is treated in a processing facility that separates the dry and wet gas components. Dry gas is often referred to as natural gas, and consists mainly of methane, but also a little ethane.
Wet gas, or NGL (Natural Gas Liquids), consists of a mixture of heavier gases (ethane, propane, butane and naphtha). In addition there are heavier condensates which some classify as a separate product. Naphtha and condensate are liquid at room temperature, while the lighter wet gas components can be made liquid either by cooling or by adding pressure.
Not all gas that is produced is sold. Some of the gas is used to generate power on the fields, and small amounts are flared for safety purposes. On some fields, gas is reinjected into the reservoirs. Reinjection is often used to maintain reservoir pressure and displace the oil. This results in efficient recovery of the oil, and the gas is stored for possible recovery in the future.

Definition of Natural Gas, LPG and NGL
In addition to the export value of crude oil, natural gas, natural gas liquids (NGL) and condensate, the Norwegian service and supply industry has a high international turnover. You can read more about their exports of goods and services in the article about the service and supply industry.
The total export value of crude oil, natural gas, NGL and condensate in 2025 was about NOK 1 000 billion, or 57 % of the total value of Norway’s exports of goods. In 2025, gas production accounted for a larger share of total export value compared to oil liquids (crude, NGL and condensate).
Export value of Norwegian petroleum, 1971-2025
Updated: 03.03.2026
The numbers are inflated with CPI Norway. 2024 and 2025 are preliminary numbers.
Source: Statistics Norway, table 08800
Print illustration Download data Export value of Norwegian petroleum, 1971-2025 Download PDF Download as image (PNG)
High Contrast Mode
Norwegian oil production reached a peak in 2001, when total liquid production, including NGL and condensate, was 3.4 million barrels of oil equivalents a day, and then declined by approximately 5 % on a yearly average until 2011. The production has since been more stable. In 2025, production of oil liquids (crude, NGL and condensate) was around 2 million barrels per day, and Norway now supplies about 2 % of global oil consumption.
In 2025, Norway exported about 89 million Sm³ (1.5 million barrels per day) of crude oil directly to other countries, and about 8 million Sm³ (0.14 million barrels per day) was delivered to onshore facilities in Norway. Crude oil purchasers are mainly refineries, which process the oil to produce fuel and other oil products.
The tables below show sales of crude, NGL and condensate in 2025 by first delivery point.
Norwegian oil deliveries in 2025, by first delivery point
Updated: 22.04.2026
Source: Norwegian Offshore Directorate
Print table Download data Norwegian oil deliveries in 2025, by first delivery point
Sale of NGL and condensate in 2025, by first receiving country
Updated: 22.04.2026
Source: Norwegian Offshore Directorate
Print table Download data Sale of NGL and condensate in 2025, by first receiving country
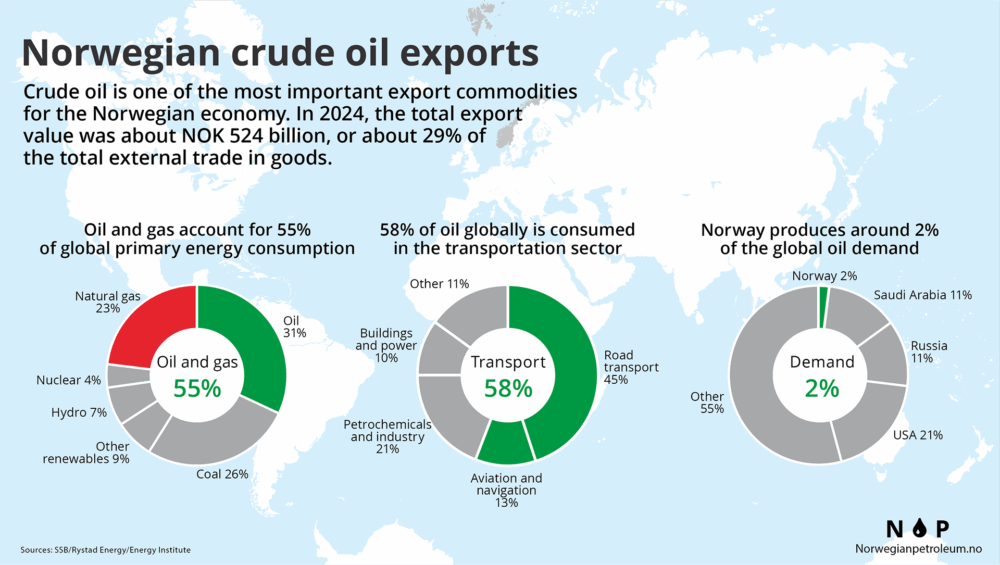
In 2025, oil was the largest energy source globally, followed by coal and gas. Oil meets about 31 % of total world energy demand.
What is oil used for?
The transport sector consumes more oil than any other sector. The second largest sector in terms of oil consumption is the petrochemical industry, and manufacturing of plastics is the most important branch of this sector. The petrochemical industry also includes the manufacture of other oil-based products such as paints, cosmetics and textiles and so on. Moreover, oil is used as fuel in other energy-intensive industries such as iron, steel and cement production. Other main uses of oil is to generate electricity and heat, and as an input for asphalt.
Which countries produce oil?
The US was the largest oil producer in 2025, followed by Saudi Arabia and Russia. Crude oil production from OPEC, the Organization of the Petroleum Exporting Countries, accounted for approximately 34 per cent of the world’s oil supply in 2025. The broader OPEC+ cooperation, which includes Russia among others, accounted for over 50 per cent of the world’s oil supply in 2025. However, there are several major oil producing countries that are not part of the OPEC+ cooperation, including the US, Canada, China and Brazil.

Oil prices
The graph below shows the average annual oil prices (Brent) from 2016 - 2025. The spot price does not necessarily reflect achieved prices from sales of oil produced on the Norwegian shelf.
Oil Price Brent, yearly average 2016-2025
Updated: 14.01.2026
Source: Refinitiv
Print illustration Download data Oil Price Brent, yearly average 2016-2025 Download PDF Download as image (PNG)
High Contrast Mode
Norway and the 10 largest oil producers in 2025
Updated: 06.07.2026
Source: Energy Institute Statistical Review of World Energy 2026
Print illustration Download data Norway and the 10 largest oil producers in 2025 Download PDF Download as image (PNG)
High Contrast Mode
Transport of crude oil
The oil from the Norwegian continental shelf is either transported by ship or through pipelines to a final delivery point on land. See article about the pipeline system for more information about oil pipelines on the Norwegian shelf.
Oil is transported from many fields on the Norwegian shelf to the markets using shuttle tankers. These are specialized tankers that take on oil via offshore loading buoys on the oil fields. Oil platforms often have limited storage capacity, and regular calls by shuttle tankers are needed to avoid stoppages because of capacity problems. Shuttle tankers are usually used for relatively short transport distances, and most Norwegian oil is therefore delivered to destinations in north-western Europe.
Larger tankers are used to carry oil that is to be transported further, for example from Norway to Mediterranean countries, Asia or America. They do not carry oil directly from the offshore fields, but from onshore terminals, which are supplied either by shuttle tankers or by pipelines from the oil fields. Pipelines are used to transport oil from the Norwegian shelf to four onshore terminals: Sture, Mongstad and Kårstø in Norway, and Teesside in the UK.
The value of Norwegian gas exports in 2025 were higher than the value of Norwegian oil exports (including NGL and condensate), as a result of high gas production and relatively high prices. Domestic consumption of gas in Norway is very low, and nearly all the gas produced is exported.
An extensive network of subsea pipelines links Norway’s offshore gas fields and onshore terminals directly to other recipient countries in Europe. The total length of the Norwegian gas pipeline network is about 8 800 kilometres, which is roughly the distance from Oslo to Bangkok. See article about the pipeline system for more information about the gas pipelines on the Norwegian shelf.
In addition, liquified natural gas (LNG) is shipped out from the Snøhvit field off Hammerfest on LNG carriers. Approximately 5% of Norwegian gas exports is LNG.
Liquified natural gas, or LNG, is produced by cooling and pressurising natural gas to a liquid state. It is transported on dedicated LNG carriers.
The advantage of LNG is that transport does not require pipelines, and it can therefore be sold anywhere in the world. However, conversion to LNG and transport by LNG carrier is considerably more energy-intensive and expensive than pipeline transport.
At present, only gas from the Snøhvit field is converted to LNG on a large scale in Norway. Globally, the supply of LNG has been growing rapidly over the last decade. It has mainly been driven by developments in the United States and Australia, amongst others and increasing demand, primarily in Asia. The growth is expected to continue the coming years.
")
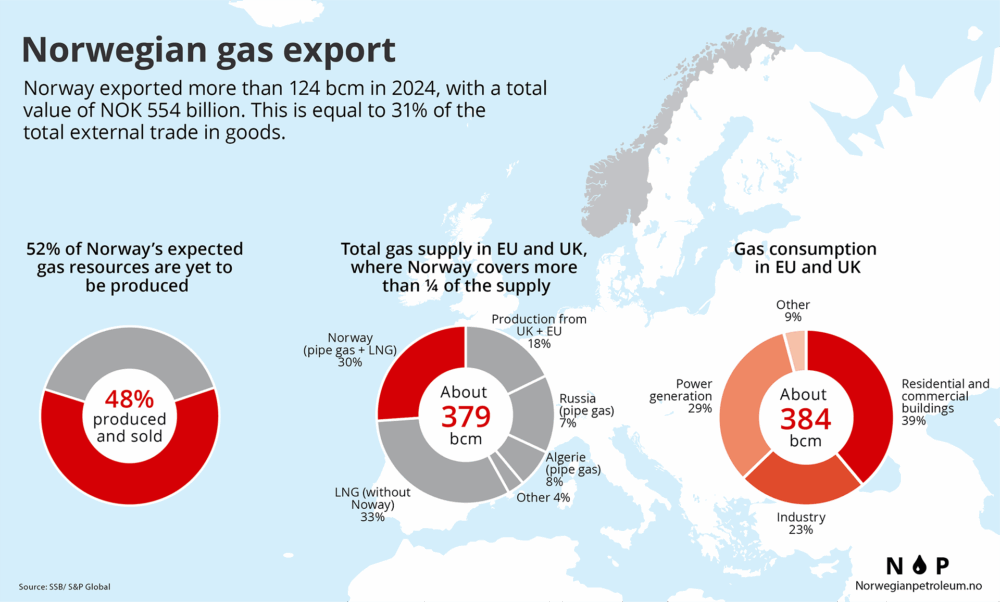
Norwegian gas exports were lower in 2025 than in 2024, which was a record year for gas production, but remained at a historically high level. In 2025, Norway exported around 122 billion Sm3 gas (not normalised to 40 MJ/Sm3), mainly to other countries in Europe. The gross energy content in the total volume of Norwegian sales gas corresponds to about eight times normal Norwegian electricity production.
In much of Europe, gas is an important source of energy for heating homes and industrial buildings, gas is used for cooking, as feedstock in industrial processes and is used in gas-fired power plants to generate electricity. Gas exports from Norway in 2025 equaled more than 30 per cent of the total gas consumption of the EU and the United Kingdom, and makes an important contribution to energy security in Europe.
How is natural gas used and what is driving growth in consumption?
Natural gas meets about 25 % of total world energy demand, and thus, like oil, plays a very important part in meeting global energy needs. Natural gas has accounted for almost one third of the world's energy consumption growth during the last decade, and the use of natural gas is expected to increase in the future as well. Natural gas is used mainly for heating homes and commercial buildings, cooking and power generation and in the petrochemical industry.
Many of the products we use every day, such as cell phones, makeup, sunglasses, computers, medications and fertilizers for agriculture are made with natural gas as a feedstock. Natural gas is transported by pipeline or is cooled and pressurised to produce LNG, which is transported on LNG carriers. Economic growth, the prices of alternative energy sources, weather, temperature, climate change adaptation and mitigation measures are all factors that influence gas demand.
Using gas instead of coal for power generation can yield considerable reductions in greenhouse gas emissions. Europe and the rest of the world collectively use a significant amount of coal for power generation. In electricity production, gas emits approximately half as much CO2 as coal. Replacing coal with gas in power generation can be a good measure to quickly reduce greenhouse gas emissions and improve air quality.
Gas is also a good partner for intermittent renewable energy. Unlike hydroelectric power, other renewable energy sources such as sun and wind cannot be stored over time and are as such less flexible. In the absence of effective storage capability of energy, gas can produce power when the sun does not shine and the wind does not blow. As Europe is getting more and more intermittent renewable energy sources, the more Europe will need the kind of flexibility gas can provide in order to balance fluctuations in the energy supply and ensure that consumers have reliable power supply.
Gas exporting countries
Norway is the fourth largest gas exporter in the world (2025). Several of the world’s largest gas producers export little to other countries. When assessing the global gas market, it is therefore most important to consider which countries have the largest volumes available for export.
Gas prices
The graph below shows the average annual European gas prices (TTF) from 2016 - 2025. The spot price does not necessarily reflect achieved prices from sales of gas produced on the Norwegian shelf.
European gas price (TTF), yearly average 2016-2025
Updated: 14.01.2026
Source: Refinitiv
Print illustration Download data European gas price (TTF), yearly average 2016-2025 Download PDF Download as image (PNG)
High Contrast Mode
Norwegian net gas exports in 2025 compared to other gas exporting countries
Updated: 07.07.2026
Source: Energy Institute Statistical Review of World Energy 2026
Print illustration Download data Norwegian net gas exports in 2025 compared to other gas exporting countries Download PDF Download as image (PNG)
High Contrast Mode
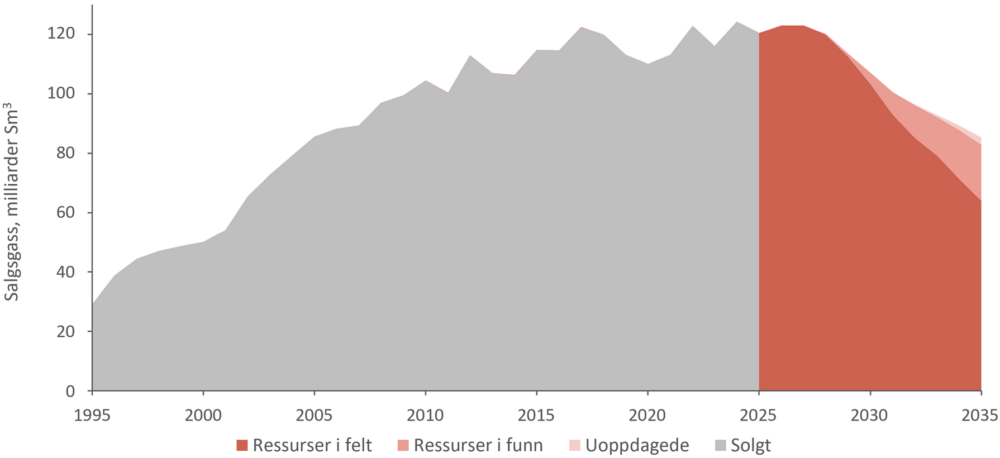
Only about half of Norway’s estimated gas resources have been produced so far. The production level is expected to remain at a high and stable level over the next years. Towards 2030 and beyond, production levels are expected to gradually decline.
Expected volumes of sales gas from Norwegian fields (1995-2035)
Updated: 09.04.2026
Source: Norwegian Offshore Directorate
Most natural gas from Norway which is sold on the European market is delivered to gas receiving terminals in Germany, the UK, Belgium, France and Denmark (with a connection to Poland through the Baltic Pipe) through the Norwegian gas pipeline network. The total length of the pipeline network is about 8 800 kilometres, which is roughly the distance from Oslo to Bangkok. Norwegian gas accounts for a large portion of the total gas consumption in these gas receiving countries; however, much of the gas is transported further to other European countries.
Norwegian natural gas exports in 2015-2025 by first delivery point
Updated: 03.03.2026
Source: Norwegian Offshore Directorate / Gassco
Print illustration Download data Norwegian natural gas exports in 2015-2025 by first delivery point Download PDF Download as image (PNG)
High Contrast Mode