Everything you need to know about Norwegian petroleum activities

Framework

The overall objective of Norway’s petroleum policy is to provide a framework for the profitable production of oil and gas in the long term. The value creation shall benefit the Norwegian society as a whole, activities must take place within a sound HSE framework, and environmental concerns and coexistence with other industries are to be taken into account throughout the industry.
Valhall

Fundamental regulatory principles

The regulatory framework for petroleum activities has been designed to give the best possible balance between the companies’ and the authorities’ interests. This is achieved among other things through taxation policy, through the Petroleum Act and through the authorities’ oversight of resource management.

The overall objective of Norway’s petroleum policy has always been to provide a framework for the profitable production of oil and gas in the long term. It has also been considered important to ensure that as large as possible share of the value creation accrues to the state, so that it can benefit society as a whole. Oil and gas activities must take place within a sound health, safety and working environment framework, and environmental concerns are to be taken into account throughout the industry. Petroleum activities must also take place in coexistence with other industries.

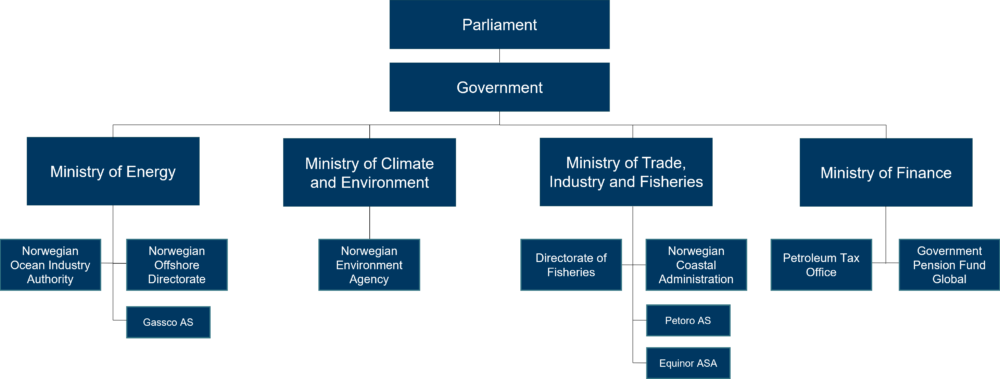
Norway has established a division of roles and responsibilities between the state and the business sector that provides a good basis for achieving the goals of Norway’s petroleum policy. The authorities regulate the sector by setting a clear and predictable overall framework. The oil companies and other actors in the industry are responsible for operational activities. Because commercial companies are responsible for exploration, development and production, it is essential to give them the right incentives – the decisions that are best for the companies must also be beneficial to society.

The regulatory framework for petroleum activities has therefore been designed to give the best possible balance between the companies’ and the authorities’ interests. This is achieved among other things through taxation policy, through the Petroleum Act and through the authorities’ oversight of resource management.

To ensure that value creation benefits Norwegian society to the greatest possible extent, the tax rate for oil and gas companies is 78 %

To ensure that value creation benefits Norwegian society to the greatest possible extent, the tax rate for oil and gas companies is 78 %. The petroleum taxation system is based on ordinary company taxation (currently 22%), but an additional special tax is levied. One key consideration in designing the petroleum taxation system was to ensure that incentives for companies to make investments were maintained. Projects that are profitable for society should also be profitable for the oil companies.

It is therefore the companies that are taxed, not the oil and gas fields. The companies are entitled to deduct all relevant costs from the tax basis. Deductions for investments (depreciation and an extra deduction from the special tax basis, called uplift), are designed to prevent the high tax rate from reducing the willingness of companies to invest on the Norwegian shelf. To ensure that companies are treated equally regardless of whether or not they are liable to pay tax, there is a system whereby companies can claim reimbursement of costs in the exploration phase as an alternative to deducting them from the tax base.

Oseberg A
Oseberg A. Photo: Harald Pettersen, Equinor (Statoil)

The Petroleum Act and the licensing system

State management and control of the industry is ensured through an extensive legislation that requires companies to obtain licences and approval from the competent authorities for all phases of petroleum activities.

The petroleum industry is the largest and most important sector of Norway’s economy measured in terms of value added, government revenues, investments and export value. It is therefore essential that the way the industry is organised and the division of roles and responsibilities takes all important public interests into account and ensures that value creation from petroleum resources benefits Norwegian society as a whole.

State management and control of the industry is therefore required. Norway has put this in place through extensive legislation that requires companies to obtain licences and approval from the competent authorities for all phases of petroleum activities.

The Petroleum Act (Act of 29 November 1996 No. 72 relating to petroleum activities) provides the general legal basis for sound resource management, including the licensing system that gives companies rights to engage in petroleum operations. The Act establishes that the Norwegian state has the proprietary right to subsea petroleum deposits on the Norwegian continental shelf.

ELdfisk II
Photo: Ministry of Energy

The life cycle

From area opening procedures to the end of production

Petroleum activities can be divided into several phases. An area must be opened for petroleum activities before any operations are permitted. The first phase is exploration, when any subsea petroleum resources are mapped and proved. If commercially viable discoveries are made, activities enter a new phase with the aim of developing the field and producing from it, at the same time ensuring sound resource management and maximising value creation. When it is no longer possible to produce profitably from a field, operations must be closed down and the installations disposed of (made safe in place or removed).

Opening new areas for petroleum activities

Before licences can be awarded for petroleum activities, the area where activities are planned must have been officially opened. As part of this process, the Ministry of Energy is required to carry out an impact assessment including an evaluation of the possible economic, social and environmental impacts of the activities. During an opening process, the authorities ensure that they have an overview of all relevant arguments for and against petroleum activities in the area in question.

During an opening process, all relevant arguments for and against petroleum activities in the area in question are taken into account

In addition, the general public and the parties affected are given an opportunity to put forward their views. A resource assessment of the area is also made as part of the opening process. Decisions on whether or not to open new areas for petroleum activities are made by the Storting (Norwegian parliament). Impact assessments and opening of new areas are governed by Chapter 3 of the Petroleum Act and Chapter 2a of the Petroleum Regulations.

Award of production licences

A production licence grants exclusive rights to exploration, exploration drilling and production of petroleum in the area covered by the licence. It also regulates other rights and duties of the licensees vis-à-vis the Norwegian state. Production licences supplement the provisions of the legislation and set out detailed conditions for activities in a particular area. Licensees become the owners of a share of the oil and gas produced proportional to their share of the ownership. An example of a standard production licence with appendices is available on the website of the Ministry of Energy.

Production licences are normally awarded through licensing rounds, in which the Ministry announces that companies can apply for production licences in certain geographical areas (blocks). The announcement procedures, who can apply, the content of applications and application procedures are governed by Chapter 3 of the Petroleum Act and Chapter 3 of the Petroleum Regulations. The Norwegian Offshore Directorate has drawn up detailed guidelines for applications in addition. These are available on the Directorate’s website.

On the basis of the applications received, production licences are awarded to groups of companies. Awards are made on the basis of fair, objective and non-discriminatory criteria that are announced in advance.

Documents

Unofficial translations of standard documents relating to petroleum activities:

The model production licence for awards in numbered licensing rounds (frontier areas): Model production licence (in Norwegian)

The model production licence for "Awards in Pre-defined Areas" (APA) licensing rounds (mature areas): Model Production Licence APA

Agreement concerning petroleum activities incl attachments: Companies being awarded a production licence are obliged to enter into an Agreement concerning petroleum activities. The agreement consists of a main part – Special provisions – and two attachments; Attachment A – Joint Operating Agreement and Attachment B – Accounting Agreement. These standard documents have been prepared in two different versions depending on whether the State has or has not retained a participating interest in the relevant production licence. The documents are available here:

Agreement concerning Petroleum Activities incl Attachments A and B – with State participation

Agreement concerning Petroleum Activities incl Attachments A and B – without State participation

"Standard stratigraphic agreement": Licensees in production licences for stratigraphically divided areas will be required to enter into a standardized agreement regulating the relationship between the two licence groups.

The model unit agreement has been prepared in cooperation with Offshore Norge and was approved by the Ministry of Energy in 2012. The agreement is based on the model joint operating agreement, and reflects the latest amendments made to that agreement with respect to dispute resolution: Model unit agreement  

In each case, the Ministry designates an operator for the joint venture, and this company is responsible for the operational activities authorised by the licence. The licensee group finances the activities jointly. Each licensee is expected to make use of its own particular expertise, and all the licensees have a responsibility for controlling the operator’s activities.

Licensing rounds

Licensing rounds

Two types of licensing rounds have been established to ensure adequate exploration of both mature and frontier areas of the Norwegian continental shelf. All areas that are open and therefore available for petroleum activities may be announced in numbered licensing rounds or through the system of awards in predefined areas (APA). The parts of the shelf to be included in each of the two types of rounds are determined on the basis of expert assessments of the maturity of different areas, particularly in relation to the need for stepwise exploration and utilisation of time-critical resources.

The main differences between numbered licensing rounds and APA rounds are in the stages before licensing rounds are announced; after this stage, the procedures and award process are very similar.

Numbered licensing rounds in frontier areas

Numbered licensing rounds are used for frontier areas, where there is limited knowledge of the geology, greater technical challenges than in mature areas and a lack of infrastructure.

The strategy for licensing rounds in recently opened and frontier areas has generally been based on the principle of step by step or sequential exploration. This means that the results gained from exploration wells drilled in selected blocks in an area should be available before any new blocks are announced in the same area. In this way, it is possible to map large areas with a relatively small number of wells.

Before a numbered licensing round is announced, there is a nomination process. This starts when all the oil companies on the Norwegian shelf, both existing licensees and prequalified companies, are asked to nominate blocks for inclusion in the licensing round.

There is a limit on the number of blocks companies can nominate, and they are asked to give grounds for their selections based on their own geological assessments. The Norwegian Offshore Directorate reviews all the nominations it receives and makes its own geological assessment.

Next, the Directorate sends its recommendations for the blocks to be included in the licensing round to the Ministry of Energy. In the 20th licensing round, the Directorate’s recommendations were for the first time submitted to public consultation, and this has become normal procedure in subsequent licensing rounds. The Government makes the final decision on which blocks are to be announced, including any special environmental and fisheries-related requirements for petroleum activities.

After the applications have been received, they are assessed in relation to criteria announced in advance and negotiations are held with the companies. The Government decides which licences to award to which companies, and the final awards are formally made by the King in Council.

Numbered licensing rounds have been held since 1965, and are normally announced every other year.

Awards in predefined areas (APA) in mature areas

APA licensing rounds are used for mature areas, where petroleum activities have been in progress for many years. In such areas the geology is well known, there are fewer technical challenges, and there is well developed or planned infrastructure.

As new areas mature, the APA areas can be expanded within the framework for petroleum activities in each sea area. The areas of the Norwegian shelf where most is known about the geology are included on the basis of expert assessments. No acreage is withdrawn from the APA areas, although exceptions can be made if important new information becomes available.

There is no nomination step in APA rounds. Before a round is announced, the Offshore Directorate sends its recommendations on the inclusion of any new blocks in the APA areas, based on expert assessments, to the Ministry of Energy. The final proposal for APA areas to be announced in the licensing round is submitted to public consultation.

As in numbered licensing rounds, the Government makes the final decision on which blocks are to be announced, including any special environmental and fisheries-related requirements for petroleum activities. Companies can apply for licences for all acreage in APA areas not already covered by production licences.

After the applications have been received, they are assessed in relation to criteria announced in advance and negotiations are held with the companies. Which licences to be offered is thereafter decided by the the Government and the final awards are made by the King in Council.

The APA system was introduced in 2003 to ensure that profitable resources in mature areas are proven and recovered before existing infrastructure is shut down. If this is not done, profitable resources may remain unrecovered because the deposits are too small to justify the building of separate infrastructure. 21 APA licensing rounds have so far been initated (APA 2003-2023).

APA licensing rounds are announced annually.

The exploration phase

Once awarded, a production licence applies for an initial period of up to ten years, which is reserved for exploration activity. To ensure that the area to which the production licence applies is explored properly, the licensee group is obliged under the terms of the licence to carry out a work programme. The obligatory work commitment of the production licence may include geological and/or geophysical activities and exploration drilling. The licence includes deadlines for carrying out the different activities.

If all the licensees agree, they may relinquish the production licence once they have completed the obligatory work. Areas relinquished in this way can later be awarded to new licensee groups. This ensures that mapping of the petroleum resources in different parts of the Norwegian continental shelf is steadily improved. As a result, we now have extensive knowledge of the subsea resources in many areas.

Licensing position for the Norwegian shelf

Download as image (PNG)

The map gives an overview of the current status of the Norwegian continental shelf. The green areas have been opened for petroleum activity by the Storting (Norwegian parliament). The yellow areas have also been opened, but are subject to special arrangements as described in the white paper no. 20 (2019-2020). The areas outlined in red are covered by the system of awards in predefined areas (APA). Source: The Norwegian Offshore Directorate

Area status of the Norwegian continental shelf
Source: Norwegian Offshore Directorate

The development and operation phase

If the licensees make a discovery and wish to continue work under the licence after they have fulfilled their work obligation, they are entitled to an extension period for the licence. The duration of the extension period is determined by the Ministry of Energy when the licence is awarded, and in most cases is 30 years.

Field development and operation take place during the extension period. If the licensees wish to develop a field, they are obliged to do this in a responsible way. The companies are responsible for planning and implementing development projects, but each project requires prior approval from the Ministry. Major and/or important projects are put before the Storting before the Ministry gives its approval.

The licensees must submit a plan for development and operation (PDO) of a new deposit to the Ministry as a basis for approval. If the project includes pipelines or onshore terminals, a separate plan for installation and operation (PIO) of these must also be submitted and approved.

The process ensures that all relevant arguments for and against the project are known before a decision on development is taken

A PDO/PIO consists of a development plan and an impact assessment. The latter provides an overview of the likely impacts of the project on the environment, fisheries and society otherwise. The report on the impact assessment is sent to all those who may be affected by the project so that they have an opportunity to put forward their views. The process ensures that all relevant arguments for and against the project are known before a decision on development is taken, that the field developments approved are responsible, and that their impacts on other public interests are acceptable. In special cases, the Ministry may exempt licensees from the requirement to submit a PDO/PIO.

The Ministry of Energy has together with the Ministry of Labour and Social Inclusion drawn up guidelines for PDOs and PIOs, which explain the legislation further and detail what the authorities expect from developers. The guidelines are also available on the Norwegian Offshore Directorate’s website.

The development and operation phase is further regulated by Chapter 4 of the Petroleum Act and Chapter 4 of the Petroleum Regulations.

The suppply vessel Viking Queen is powered by LNG - picture taken from Edvard Grieg
The suppply vessel Viking Queen is powered by LNG - picture taken from Edvard Grieg. Photo: Ministry of Energy

Cessation of petroleum activities

Requirement to submit a decommissioning plan

The Petroleum Act requires licensees to submit a decommissioning plan to the Ministry between two and five years before the production licence expires or is relinquished, or use of a petroleum installation will be terminated permanently. A decommissioning plan consists of two parts: an impact assessment and plans for disposing of the installations.

The impact assessment must provide an overview of the possible environmental and other impacts of the shut-down process. The disposal part must contain detailed plans for closing down operations and decommissioning installations in the best possible way.

Cessation of petroleum activities and decommissioning are governed by Chapter 5 of the Petroleum Act and Chapter 6 of the Petroleum Regulations. In addition, Norway is bound by international law and guidelines. In this context, Decision 98/3 under the OSPAR Convention is particularly important to the Norwegian authorities. The decision generally prohibits leaving disused offshore installations in place, with limited exceptions.

Health, safety and environment and prevention of pollution

The actors in the Norwegian petroleum industry are highly professional and take a very cautious approach, and there is broad-based tripartite cooperation between employers, trade unions and the state. The Government’s ambition is for Norway’s petroleum industry to be a world leader in health, safety and environment work. The legislation that has been adopted sets strict requirements as regards the responsibilities of individual enterprises for risk identification, risk reduction, preparedness and response. Management of major accident risk is required to be an integral part of petroleum activities.

The authorities and the parties in the industry have together developed a tool for measuring trends in risk levels in Norwegian petroleum activities, known as RNNP. The Norwegian Offshore Directorate publishes annual reports that give a picture of risk trends in the industry as a whole.

The ambition is for Norway’s petroleum industry to be a world leader in health, safety and environment work

Liability for pollution damage is governed by Chapter 7 of the Petroleum Act, which states that licensees are strictly liable for pollution damage, i.e. they are liable regardless of fault.

Chapters 9 and 10 of the Petroleum Act and regulations under the Act govern safety requirements for the industry.

State organisation of petroleum activities

To ensure that the petroleum industry takes important public interests into account and that resources are utilised as effectively as possible, the petroleum industry must be well organised, with clearly defined areas of responsibility.

Responsibilities

The Storting
The Storting (Norwegian parliament) sets the framework for petroleum activities in Norway, partly through its legislative powers. All matters of principle, including major development projects, must be debated by the Storting. The Storting also supervises the government and the public administration.

Even though the composition of the Storting varies over time, the overall framework for Norwegian petroleum policy has remained stable. For many years, there has been broad political agreement on the main lines of petroleum policy, which has provided the industry with a predictable and stable framework for its operations. This is particularly important for the petroleum industry, which has a long time horizon for its operations and is highly capital intensive.

State organisation of petroleum activities

Download as image (PNG)

Source: The Ministry of Energy

State organisation

Government, ministries and subordinate agencies
Executive powers rest with the Government, which is responsible for carrying out petroleum policy and is accountable to the Storting. The Government is assisted in this role by the ministries and subordinate agencies. Responsibility for implementing petroleum policy is divided as follows:

Ministry of Energy and Norwegian Offshore Directorate
The Ministry of Energy is responsible for resource management and the petroleum sector as a whole. It is also responsible for the working environment and for safety and emergency preparedness in the petroleum sector. The Ministry is also responsible for managing the state’s ownership interests in Gassco AS.

The Norwegian Offshore Directorate is a subordinate agency of the Ministry of Energy. It plays a key role in petroleum management and is an important advisory body for the Ministry. The Directorate exercises administrative authority over petroleum exploration and production on the Norwegian continental shelf, and has powers to adopt regulations and make decisions under the petroleum legislation.

The Norwegian Ocean Industry Authority is a subordinate agency of the Ministry of Energy and is responsible for technical and operational safety, emergency preparedness to deal with both accidents and wilful acts such as sabotage, and the working environment throughout the petroleum industry.


Good cooperation within the public administration
Good cooperation within the public administration (Photo: Ministry of Energy, Olav Hegge)

Ministry of Finance
The Ministry of Finance has the overall responsibility for the taxation system for the petroleum sector. The Petroleum Tax Office is part of the Norwegian Tax Administration, which is subordinate to the Ministry of Finance. The main function of the Petroleum Tax Office is to ensure correct assessment and collection of the taxes laid down by the political authorities.

The Directorate of Norwegian Customs is responsible for correct assessment and payment of the NOx tax.

The Ministry of Finance is also responsible for management of the Government Pension Fund Global. Operative responsibility has been delegated to Norges Bank (the Norwegian central bank).

Ministry of Trade, Industry and Fisheries
The Ministry of Trade, Industry and Fisheries is responsible for managing the state's ownership interests in Equinor ASA (former Statoil), Petoro AS and for the State's Direct Financial Interest (SDFI) in the petroleum industry. It is also consulted as part of the procedures for awarding licences, to facilitate coexistence between the petroleum and fisheries industries.

The Ministry is also responsible for preparedness and response to acute pollution in Norwegian waters. The Norwegian Coastal Administration is one of its subordinate agencies and is responsible for governmental oil spill preparedness and response.

Ministry of Climate and Environment
The Ministry of Climate and Environment has overall responsibility for environmental policy and environmental protection in Norway. The Norwegian Environment Agency is a subordinate agency of the Ministry, and has inspection and enforcement responsibilities under the Pollution Control Act.

State ownership

Petoro AS
Petoro is a wholly state-owned company that manages the commercial aspects of the State’s Direct Financial Interest (SDFI). Through the SDFI, the Norwegian State participates directly in petroleum activities on the Norwegian continental shelf. Petoro is the licensee for the state’s share of production licences and ownership in fields and pipelines on the Norwegian shelf and associated onshore facilities.

Petoro’s main objective in managing the SDFI is to maximise state revenues from the portfolio. Petoro was established in 2001 and has almost 70 employees. The Ministry of Trade, Industry and Fisheries is responsible for managing the state’s ownership of Petoro.

Equinor ASA (former Statoil)
Equinor is an international energy company with about 21 000 employees in over 30 countries. Its main activities are oil and gas production, and the company is operator for about 70 % of all oil and gas production on the Norwegian shelf. The company was established in 1972 and is listed on the Oslo and New York stock exchanges.

Equinor's board is responsible for commercial development of the company. The Norwegian state owns 67 % of the shares in the company, and the Ministry of Trade, Industry and Fisheries is responsible for managing the state’s ownership interest.

The objective of state ownership of Equinor is to maintain a knowledge-based, high-technology company that has its main base in Norway. Equinor is run on a commercial basis.

Gassco AS
Gassco was established in 2001 and is a wholly-owned state company. Gassco does not make a profit or a loss from its own operations. Gassco is the neutral and independent operator of the gas transport system, and is responsible for operating the infrastructure on behalf of the owners. The Ministry of Energy manages the state’s ownership interest in Gassco.

Norway’s petroleum history

When the first production licences were awarded in the mid-1960s, hardly anyone realised what a huge impact the industry would have on the Norwegian economy. Fifty years later, it is more important than ever.

Norway’s petroleum era started more than 50 years ago, and a number of the early fields are still producing. The first fields to be developed were in the North Sea, and the industry has gradually expanded northwards into the Norwegian Sea and the Barents Sea.

At the end of the 1950s, very few people believed that there were rich oil and gas deposits to be discovered on the Norwegian continental shelf. The Geological Survey of Norway even wrote to the Ministry of Foreign Affairs in 1958 stating that the possibility of finding coal, oil or sulphur on the continental shelf off the Norwegian coast could be discounted. But the discovery of the Groningen gas field in the Netherlands in 1959 opened people’s eyes to the prospect that there could be hydrocarbons under the North Sea.

In October 1962, Phillips Petroleum sent an application to the Norwegian authorities requesting permission for exploration activities in the North Sea. The company asked for a licence for the parts of the North Sea that were in Norwegian territorial waters and that were or might be designated as part of the Norwegian continental shelf, and offered USD 160 000 per month. This was regarded as an attempt by the company to obtain exclusive rights. The authorities decided that it was out of the question to hand over the entire continental shelf to one company. If these areas were to be opened for exploration, more companies would need to be involved.

Dividing the continental shelf into quadrants and blocks

Each of the sea areas are divided into quadrants measuring one degree of longitude by one degree of latitude. The quadrants in the North Sea are numbered from 1 to 36, while those in the Norwegian Sea and Barents Sea are numbered by longitude and latitude. Each quadrant is further divided into 12 blocks.

First edition of "Sokkelkartet" from 1965

Download as image (PNG)

The map shows the licensing position from the first round in 1965 (Source: Norwegian Offshore Directorate)

The first map of the Norwegian continental shelf showing the licensing position
Source: Norwegian Offshore Directorate

In May 1963, the Norwegian Government proclaimed sovereignty over the Norwegian continental shelf. A new act was adopted establishing that any natural resources on the shelf belong to the Norwegian state, and that only the King (in practice the Government) has the authority to award licences for exploration and production. Despite Norway’s proclamation of sovereignty over large sea areas, it was still necessary to clarify the delimitation of continental shelf, and primarily the boundaries with Denmark and the UK. In March 1965, agreements were concluded on the delimitation of the continental shelf on the basis of the median line principle.

Video: The petroleum history

Norway’s first licensing round was announced on 13 April 1965, and 22 production licences were awarded, covering 78 geographically delimited areas (blocks).

The licences granted an exclusive right to explore, drill and extract oil and gas in the areas to which they applied. The first exploration well was drilled in summer 1966, but proved to be dry. The first oil discovery on the Norwegian shelf was Balder in 1967. However, it was not considered to be economically viable at the time, and it took another 30 years before the field was finally developed.

Just before Christmas in 1969, Phillips informed the Norwegian authorities of the discovery of Ekofisk, which turned out to be one of the largest offshore oil fields ever discovered. This was when Norway’s success story started in earnest. Production from the field started on 15 June 1971. A series of major discoveries was made in the next few years.

Historical timeline of some important fields

Download as image (PNG)

Production start and year of discovery in brackets. (Source: Norwegian Offshore Directorate)

Historical timeline - production start and year of discovery in brackets
Source: Norwegian Offshore Directorate

In the 1970s, exploration activity was concentrated in the areas south of 62°N (Stad). The continental shelf was opened gradually, and only limited numbers of blocks were announced in each licensing round. The most promising areas were explored first. This led to world-class discoveries, and production from the Norwegian continental shelf has been dominated by large fields such as Ekofisk, Statfjord, Oseberg, Gullfaks and Troll. These fields are still very important for the development of Norway’s petroleum industry.

It has also been possible to tie in a number of other fields to the infrastructure established for the major fields. Production from several of the largest fields is now declining, and a number of new, smaller fields have been developed. As a result, petroleum production is now split between a larger number of fields than before.

In 1979, the area north of 62°N was also opened for petroleum activities. Exploration in parts of the Norwegian Sea and Barents Sea began early in the 1980s, and was later expanded to new areas as they were opened. In 1993, production began in the Norwegian Sea, and in 2007 it was the turn of the Barents Sea.

Accumulated resources on the Norwegian continental shelf, 1966-2022

Download as image (PNG)

(Source: Norwegian Offshore Directorate)

Accumulated resources on the Norwegian continental shelf, 1966-2022
Source: Norwegian Offshore Directorate

In the early days, foreign companies dominated exploration activities, and they were responsible for developing the first oil and gas fields. Norwegian participation gradually increased as Norsk Hydro became involved. Saga Petroleum, a private Norwegian company, was established in 1972. Statoil (now Equinor) was also established in 1972, with the Norwegian state as sole owner. Norway also established the principle that the state was to have a 50 per cent ownership interest in every production licence.

From 1 January 1985, this system was reorganised. The Norwegian state’s participating interest was split in two: one part linked to Statoil and one to the State’s Direct Financial Interest (SDFI) in the petroleum industry.

The SDFI system means that the Norwegian state owns holdings in a number of oil and gas fields, pipelines and onshore facilities. The proportion is determined when production licences are awarded, and varies from field to field. As one of several owners, the State covers its share of investments and costs, and receives a corresponding share of the income from production licences. Statoil was made responsible for handling the commercial aspects of SDFI on behalf of the state.

Petroleum activities have played a key role in the development of today’s welfare state in Norway

In spring 2001, the Storting (Parliament) decided that 21.5 % of the value of the SDFI portfolio could be sold; 15 % was sold to Statoil and 6.5 % to other licensees. The sale of part of the SDFI portfolio to Statoil was seen as an important element in the successful part-privatisation of the company. Statoil was listed on the stock exchange in June the same year, and now operates in the same way as any other commercial actor on the Norwegian continental shelf. The state-owned enterprise Petoro was established in May 2001 to manage the SDFI on behalf of the state. In 2007,  Statoil merged with Norsk Hydro’s oil and gas division. In 2018, Statoil changed its company name to Equinor.

Macroeconomic indicators for the petroleum sector, 1971-2024

Updated: 06.10.2023

2023 and 2024 are preliminary numbers from the National Budget 2024.

Source: Statistics Norway (National accounts), Ministry of Finance (National Budget 2024)

Print illustration Download data Macroeconomic indicators for the petroleum sector, 1971-2024 Download PDF Download as image (PNG)

High Contrast Mode

Macroeconomic indicators for the petroleum sector, 1971-2024 – 2023 and 2024 are preliminary numbers from the National Budget 2024.

At the beginning of this century, the Norwegian shelf was opened up to more types of companies as a way of ensuring sound resource management. The large international oil companies that were already established on the shelf were joined by other types of companies that could see different kinds of commercial opportunities in Norway’s petroleum resources. Today, there is a great deal of diversity and competition on the Norwegian shelf, and a large number of both Norwegian and foreign companies are active.

Picture of the Ekofisk complex
Picture of the Ekofisk complex in 2014. Ekofisk was the first major discovery on the Norwegian shelf (Photo: ConocoPhillips)

When the first production licences were awarded in the mid-1960s, hardly anyone realised what a huge impact the industry would have on the Norwegian economy. Petroleum activities have played a key role in the development of today’s welfare state in Norway. Figures for the petroleum industry’s share of total value creation, investments, exports and revenues over the years show this very clearly.

Activity on the Norwegian shelf will continue to be vital to the Norwegian economy in the years ahead: there are large remaining resources, and major new projects such as the development of Johan Sverdrup are under way.

Last edition of "Sokkelkartet" from 2023

Download as image (PNG)

(Source: Norwegian Offshore Directorate)

Map of the Norwegian continental shelf 2023
Source: Norwegian Offshore Directorate

Environment and technology

Environmental and climate considerations are an integral part of Norway’s policy. A range of policy instruments ensures that actors in the industry take environmental and climate considerations into account during all phases of their activities, from exploration to development, operations and field closure. Also, production of the remaining resources on the Norwegian shelf will generate substantial value creation, but to realise this potential, new knowledge and technology must be developed. Research and technology is therefore an integral part of Norway's policy of the petroleum industry.
Skarv

Emissions to air

Environmental and climate considerations are an integral part of Norway’s policy for the petroleum industry, and the Norwegian petroleum industry has high environmental and climate standards compared with those in other petroleum producing countries.

Environmental and climate considerations are an integral part of Norway’s policy for the petroleum industry. A range of policy instruments ensures that actors in the industry take environmental and climate considerations into account during all phases of their activities, from exploration to development, operations and field cessation.

Environmental and climate standards in the Norwegian petroleum industry are very high compared with those in other petroleum producing countries. This is a result of effective policy instruments and joint initiatives between the authorities and oil companies on research, technology development and increased knowledge.

Emissions to air from petroleum activities originate from the combustion of natural gas and diesel in turbines, engines and boilers, flaring of natural gas for safety reasons, venting and diffuse emissions of gas, and storage and loading of crude oil. These activities result in emissions of waste gas containing CO2 (carbon dioxide), NOx (nitrogen oxides), NMVOCs (non-methane volatile organic compounds), CH4 (methane) and sulphur dioxide (SO2).

The companies operating on the Norwegian shelf are front runners in the use of solutions to reduce or to avoid greenhouse gas emissions

Emissions from Norwegian petroleum activities are regulated through several acts, including the Petroleum Act, the CO2 Tax Act on Petroleum Activities, the Sales Tax Act, the Greenhouse Gas Emission Trading Act and the Pollution Control Act.

Requirements for impact assessments and approval of plans for new developments (PDOs/PIOs) are cornerstones of the petroleum legislation. Facilities onshore and within the baseline are also subject to the provisions of the Planning and Building Act.

Emissions from the petroleum sector in Norway are well documented. The industry’s own organisation, Offshore Norge, has established a national database for reporting all releases from the industry, called Footprint. All operators on the Norwegian continental shelf report data on emissions to air and discharges to the sea directly in Footprint.

Photo: Ministry of Energy

Greenhouse gas emissions

In 2022, greenhouse gas emissions from petroleum activities corresponded to about 11,9 million tonnes COeq (carbon dioxide equivalent). Emissions from the petroleum sector account for about one quarter of Norway’s aggregate greenhouse gas emissions.

The projections of emissions from oil and gas production are prepared by the Norwegian Offshore Directorate and are based on reporting from the oil companies. The definition of the petroleum industry follows the definition of the Petroleum Tax Act, except the facility at Kårstø which is also included in the emission scope. Operations at the onshore facilities, which is linked to further transport of gas, are included in the projections at Statistics Norway (SSB), so that the projections are in line with the emissions greenhouse gas inventory accounts. Emissions from the construction and installation phase, maritime support services and helicopter traffic are included in other industries.

CO2 emissions from the petroleum sector are expected to be relatively stable the next few years.

Greenhouse gas emissions from the petroleum sector

Updated: 06.10.2023

Historical numbers for 2000-2022 and projections for 2023-2027

Source: Norwegian Offshore Directorate

Print illustration Download data Greenhouse gas emissions from the petroleum sector Download PDF Download as image (PNG)

High Contrast Mode

Greenhouse gas emissions from the petroleum sector – Historical numbers for 2000-2022 and projections for 2023-2027

The companies operating on the Norwegian shelf are front runners in the use of solutions to reduce and prevent greenhouse gas emissions. Emissions per unit of oil and gas produced are therefore lower compared to similar operations in other petroleum-producing countries.

Energy efficiency measures, including the introduction of energy management systems and the installation of more energy-efficient equipment such as compressors and pumps, have helped to reduce emissions from petroleum activities. Combined-cycle gas turbines (CCGT) are one technological solution, in which waste heat from the turbines is used to produce steam, which in turn is used to generate electricity. CCGT plants improve energy efficiency and reduce emissions. They are installed at the fields Oseberg, Snorre and Eldfisk.

Since 1996, the separation and storage of CO2 from the gas at Sleipner Vest has been ongoing. At most, one million tonnes of CO2 was separated and stored annually under the seabed in the Utsira Formation. Since 2019, CO2 from the gas to Utgard has also been stored in the Utsira Formation. The background for CO2 separation for gas from Sleipner Vest and Utgard was that the CO2 content in the gas was too high to be sold to the market. Hammerfest LNG on Melkøya separates CO2 from the well stream before the gas is chilled to produce liquefied natural gas (LNG), and has been doing so since 2008. The CO2 is transported back to the field, injected and stored.

The fields Johan Sverdrup, Ormen Lange, Snøhvit, Troll A, Gjøa, Goliat, Valhall and Martin Linge are already supplied with power from shore. In addition, the area solution for power from shore to Utsirahøyden started in December 2022. This includes the Johan Sverdrup, Edvard Grieg and Ivar Aasen fields. Gina Krog and Sleipner Øst are to be connected to the area solution by the end of 2023. Power from shore to Troll B and C, Oseberg field centre and Oseberg Sør is also under development. In addition, the onshore facilities Kårstø, Kollsnes, Melkøya LNG and Nyhamna (including the subsea facilities on the Ormen Lange field) are supplied partly or wholly with power from the grid.
The licensees on the Gullfaks and Snorre fields have decided that these fields will be partly supplied with power from floating offshore wind. Hywind Tampen is the world’s first floating wind farm to power offshore oil and gas platforms. Power production from the first turbines started in 2022 and the project was completed/in full production in 2023.

CO₂ emissions from petroleum activities in 2022, by source

Updated: 04.07.2023

Source: Norwegian Offshore Directorate

Print table Download data CO₂ emissions from petroleum activities in 2022, by source

CO₂ emissions from petroleum activities in 2022, by source

Instruments to reduce greenhouse gas emissions

The carbon tax and the Greenhouse Gas Emission Trading Act are Norway’s most important cross-sectoral climate policy instruments for cost-effective cuts in greenhouse gas emissions. Both of these instruments apply to the majority of emissions from petroleum industry, while most other sectors either have to take part in emissions trading or pay the carbon tax.

The carbon tax

Norway was one of the first countries in the world to introduce a carbon tax, in 1991. The tax is levied on all combustion of gas, oil and diesel in petroleum operations on the continental shelf and on releases of CO2 and natural gas, in accordance with the COTax Act on Petroleum Activities. For 2023, the tax rate is at NOK 1.78 per standard cubic metre of gas and NOK 2.03 per litre of oil or condensate. For combustion of natural gas, this is equivalent to NOK 761 per tonne of CO2. For emissions of natural gas, the tax rate is NOK 13.67 per standard cubic metre.

For 2024, the carbon tax is NOK 1.85 per standard cubic metre of gas and NOK 2.10 per litre of oil or condensate. For combustion of natural gas, this corresponds to NOK 790 per tonne of CO2. For emissions of natural gas to air, the rate is NOK 16.89 per standard cubic meter.

Greenhouse Gas Emission Trading

Norway’s Greenhouse Gas Emission Trading Act entered into force in 2005, and Norway joined the EU Emissions Trading System (EU ETS) in 2008. This means that Norwegian installations in the petroleum industry and other industries to which the system applies are subject to the same rules for emissions trading as those within the EU. The EU ETS is now in its fourth phase, which runs up to the end of 2030.

The EU ETS is a ‘cap and trade’ system, which sets a ‘cap’, or limit, on total greenhouse gas emissions within the system. This cap is reduced year by year so that the emission target for sectors covered by the system is met by the end of the period. Emission allowances are allocated by auctioning or free of charge. Sectors that are considered to be at risk of carbon leakage receive some or all of their allowances free of charge. This applies to a certain proportion of petroleum-sector emissions to which the ETS applies.

The EU ETS price has been increasing in recent years. In 2022, the average cost of an emission allowance entitling the holder to emit one tonne of CO2 was approximately 81,24 euros, corresponding to approx. NOK 820.

The combination of the carbon tax and the emissions trading system means that companies on the Norwegian shelf pay approx. NOK 1500 per tonne for their CO2 emissions, which is significantly higher than for most other businesses in Norway and much higher than in other countries with petroleum activities. Accrued domestic carbon tax in 2022 was at NOK 7 billion. Emissions from the petroleum sector subject to the EU ETS was around 10,6 million tonnes in 2022. With average 2022 EU ETS price and exchange rate this corresponds to a total carbon credit cost of around NOK 8,7 billion. Combined, this means that the companies on the Norwegian shelf had a total emission cost of approx. NOK 16 billion. Actual paid emission cost could be somewhat lower due to free of charge carbon credit allocations.

Permits and other requirements

Before the licensees can develop a discovery, their plan for development and operation (PDO) must be approved by the Ministry of Energy. The PDO contains information on how the licensees intend to develop and operate the field. Whenever proposals are made for new field developments or large-scale modification of existing facilities, the operator must as part of the PDO include an overview of energy needs and an assessment of the costs of using power from shore rather than gas turbines to supply electricity.

Flaring of natural gas is only permitted when necessary for safety reasons. Permit for flaring are issued by the Ministry of Energy.

A permit under the Pollution Control Act is required for emissions to air from petroleum operations.

Other emissions to air

NOx emissions

The petroleum sector accounts for just over a quarter of Norway’s total NOx emissions.

What do we mean by NOx?

NOx is a generic term for two oxides of nitrogen, NO and NO2. They cause acidification of river systems and soils, which has direct environmental impacts including harm to fish, wildlife and ecosystems. NOx emissions also have indirect impacts because they are involved in the formation of ground-level ozone, which can damage vegetation and materials. In addition, NOx can trigger respiratory complaints. Studies show that the environmental impacts of NOx emissions vary considerably depending on where they take place, and that emissions in urban areas have the most serious effects.

CO2 and NOx emission levels are closely linked. The main sources of NOx emissions from offshore installations are the same as for CO2: combustion of gas and diesel in turbines and engines. The level of emissions depends both on the technology used and on fuel consumption.

Under the revised Gothenburg Protocol, Norway has undertaken a commitment to reduce its overall NOx emissions by 23 % from 2020 compared to the 2005 level. Emissions from the petroleum sector are directly regulated by means of conditions included in plans for development and operation (PDOs) and in permits under the Pollution Control Act.

In 2007, Norway introduced a tax on NOx emissions to encourage cost-effective emission cuts. For the petroleum industry, the tax applies to emissions from large gas turbines and machinery, and from flaring. Businesses that are affiliated with the environmental agreement between the Norwegian state and a number of business organisations on measures to reduce NOx emissions are exempted from the tax.

Most companies in the petroleum sector have chosen to participate in this agreement, and pay a contribution of NOK 16,5 per kg NOx to the NOx Fund in 2018. For companies in other branches of industry, the contribution is NOK 10,5 per kg NOx. The fund’s income is used to support investments by companies that are parties to the agreement to reduce their NOx emissions.

Historical and projected emissions of NOx from the petroleum sector in Norway

Updated: 04.07.2023

Historical numbers for 2000-2022 and projections for 2023-2027

Source: Norwegian Offshore Directorate

Print illustration Download data Historical and projected emissions of NOx from the petroleum sector in Norway Download PDF Download as image (PNG)

High Contrast Mode

Historical and projected emissions of NOx from the petroleum sector in Norway – Historical numbers for 2000-2022 and projections for 2023-2027

NMVOC emissions

The petroleum sector accounts for about a fifth of Norway’s total NMVOC emissions and the main sources of NMVOC emissions are storage and loading of crude oil offshore. Gas terminals are another smaller source of these emissions.

Since the early 2000s, NMVOC emissions from the petroleum sector have been substantially reduced, mainly as a result of investment in NMVOC recovery equipment. In 2022 the total NMVOC emissions were about 26,8 thousand tonnes.

Under the revised Gothenburg Protocol, Norway has undertaken a commitment to reduce its overall NMVOC emissions by 40% from 2020 compared with the 2005 level. Emissions from the petroleum sector are directly regulated through requirements on the use of the best available techniques (BAT) and specific emission limits in permits under the Pollution Control Act.

What are NMVOCs?

NMVOCs stands for non-methane volatile organic compounds, and is a generic term for organic compounds that readily evaporate from oil, with the exception of methane. In the presence of sunlight they contribute to the formation of ground-level ozone, which can cause damage to health, vegetation and materials.

In addition, direct exposure to NMVOCs can cause respiratory problems, and they contribute indirectly to the greenhouse gas effect because CO2 and ozone are formed when NMVOCs react with oxygen in the atmosphere.

Historical and projected emissions of nmVOC from the petroleum sector in Norway, 2000-2027

Updated: 04.07.2023

Historical numbers for 2000-2022 and projections for 2023-2027

Source: Norwegian Offshore Directorate

Print illustration Download data Historical and projected emissions of nmVOC from the petroleum sector in Norway, 2000-2027 Download PDF Download as image (PNG)

High Contrast Mode

Historical and projected emissions of nmVOC from the petroleum sector in Norway, 2000-2027 – Historical numbers for 2000-2022 and projections for 2023-2027

Carbon capture and storage

If the world - and Europe - are to achieve their climate targets, a wide range of climate measures are needed, including large-scale carbon capture and storage (CCS). Norway's investment in CO₂ capture, transport and storage includes a host of activities, from research and development to full-scale demonstration and international advancement of CCS.

According to the UN Panel on Climate Change, the capture, transport and storage of CO2 emissions from the combustion of fossil energy and industrial production is crucial in order to reduce the world's greenhouse gas emissions. There are several CCS projects in operation worldwide. However, CCS is still expensive, and there is a need for additional technological development. The work on CCS is therefore largely related to the development of technology and the facilitation of cost reductions. For some industries, especially cement production and waste incineration, the capture and storage of CO2 is the only way to significantly reduce greenhouse gas emissions.

The Norwegian Parliament (Stortinget) has decided to support the realization of Longship, Norway's full-scale project for CCS, and the project is currently under construction. Norway has suitable conditions for facilitating the capture, transport and storage of CO2. If we succeed in capturing and storing CO2, it will be significantly cheaper to achieve the climate goals. Longship contributes in making this more feasible and less costly.

In later years, there has been an increasing interest inn CCS both in Europe and Norway. More countries and companies investing in, and developing, CCS solutions are necessary for CCS to become an effective climate measure.

What is carbon capture and storage?

CO2 management involves capturing, transporting and storing CO2 from power production or industrial processes. The term Carbon Capture and Storage (CCS) is widely used.

The purpose of CCS is to limit the quantity of CO2 emissions released into the atmosphere by capturing CO2 and then storing it securely.

Capture

CO2 can be captured from flue (waste) gases at power plants and from industrial production. CCS is used in production of blue hydrogen, which consists of steam reforming of natural gas and capturing and storing the CO2 emissions produced. It is also possible to separate CO2 directly from natural gas during processing to achieve the required quality before the gas is transported to customers by pipeline or ship. Additionally, CO2 can be extracted directly from air, so-called direct air capture (DAC). Capturing CO2 from flue gas is more expensive than capturing CO from natural gas. DAC is the most expensive of these technologies.

There are several available technologies for capturing CO2 from flue gas, and some of these are being tested at the technology centre for CO2 capture at Mongstad. The world's first full-scale facility for CO2 capture from coal power opened in Canada in October 2014. More information on various capture methods can be found here.

Transport

CO2 in larger quantities can be transported by pipeline or by ship. The best option generally depends on the quantity of CO2 to be transported and the distance between the CO2 source and storage site. Transport by ship is better suited to smaller quantities and greater distances, whereas transport by pipeline transport is better suited to larger quantities and shorter distances.

Storage

There is significant potential for large-scale storage of CO2 under the Norwegian continental shelf, and it is vital to ensure that the CO2 does not leak from where it is stored. Thus, storing CO2 under the seabed is the most secure option in Norway. There are large geological formations at great depths under the seabed that provide suitable pressure and temperature conditions preventing the CO2 from moving up the rock and sand layers towards the seabed. The Norwegian Offshore Directorate has compiled a CO2 storage atlas for the Norwegian continental shelf.

Norway has extensive experience with CO2 management. Since 1996, CO2 from gas production on the Norwegian continental shelf has been captured and reinjected into sub-seabed formations. The CO2 management projects at Sleipner and Snøhvit are the only CO2 management projects in operation in Europe today and are unique in the offshore industry:

  • Since 1996, nearly one million tonnes of CO2 per year have been separated during processing of natural gas from the Sleipner Vest field, and stored in the Utsira formation.
  • Since 2019, CO2 from natural gas production at the Utgard field has also been separated out at the Sleipner Vest platform and stored in the Utsira formation.
  • Since 2008, the Snøhvit facility on Melkøya has been separating CO2 from the well stream before the gas is chilled to produce liquefied natural gas (LNG). The CO2 is transported back to the Snøhvit field by pipeline and injected into a subsea formation. During normal operations, up to 700 000 tonnes of CO2 a year is stored here.


Illustration of CCS on the Sleipner field
Illustration of CO2 injection and storage on the Sleipner field in the North Sea. The gas from the field has a high content of CO2. During processing of the gas on the platform, CO2 is separated out and injected into the Utsira formation far below the seabed. Since 1996, up to 1 million tonnes of CO2 a year has been stored here. Equinor (former Statoil) is the operator for Sleipner (Photo: Alligator film/BUG, Equinor).

Longship

In autumn 2020, the Parliament agreed to a funding model and the conditions for further project development of Longship. Longship is the largest climate technology investment in Norwegian industry. The projects aims to provide knowledge showing that CCS is safe and feasible, reduce barriers and costs for future projects, and facilitate learning and experience related to regulation and incentivization of subsequent CCS activities. If successful, Longship can contribute to large-scale CCS, which can be an important measure against climate change.

Longship is an industrial project with potentially large ripple effects both in Norway and around the world. If large-scale carbon capture and sub-seabed storage on the Norwegian continental shelf is successful, it can both secure jobs and create new ones. In addition, it can be an important tool for reducing greenhouse gas emissions from high-emission industries, such as the cement or wate industry.

The total cost estimate for Longship (investments and 10-year operating costs) is a total of approximately NOK 28 bn. The government’s share of expected investments and operating costs is estimated around NOK 18 bn.

The implementation of Longship is ongoing in line with Meld. St. 33 (2019-2020).

Longship consists of three parts that together constitute the state-funded project Longship; capture, transport and storage of CO2:

  • Norcem will capture CO2 from its cement factory in Brevik. From Brevik, the CO2 will be transported by ship to a new reception terminal in Øygarden in Hordaland. Then, the CO2 will be sent through pipelines and permanently stored in a geological formation about 2,600 meters below the seabed. The construction of the carbon capture project at Norcem is well underway.
  • Hafslund Oslo Celsio (previously Fortum Oslo Varme) will capture CO2 from flue gas at the waste incineration facility in Oslo. About 400 000 tonnes of CO2 will be captured each year, transported to the port of Oslo and then by ship to the storage site. Construction work started in summer of 2022, and the capture facility is expected to be completed in 2026.
  • The transport and storage part of the project has been named Northern Lights and is a collaboration between Equinor, Shell and Total. The plan is to develop Northern Lights in two phases. The first phase is part of the Longship project and has an estimated capacity of 1.5 million tonnes of CO2 per year over an operating period of 25 years. A possible second phase would have an estimated capacity of 5 million tonnes of CO2 per year. The construction of Northern Lights' transport and storage solution is progressing well. Northern Lights are experiencing great interest from international actors and are in active negotiations with potential customers who are considering using their storage solution. In late August 2022, Northern Lights and Yara in the Netherlands announced the first letter of intent on commercial terms for transport and storage of CO2 across national borders, with the intension of receiving 800 000 tonnes CO2 annually from 2025.


Announcement of areas for CO2 storage on the Norwegian shelf

There is an increasing commercial interest from companies regarding CO2 storage on the Norwegian continental shelf. Norwegian authorities want to facilitate profitable storage of CO2 on the shelf. Companies with the necessary expertise and with specific, industrial plans that involve the need for carbon storage solutions on a commercial basis can apply to the Ministry of Energy for a permit adapted to the needs of the company. Until now (July 2023), the Ministry of Energy has granted six permits under the CO2 storage regulations (lagringsforskriften), five in the North Sea and one in the Barents Sea. In January 2023, a new area for the storage of CO2 was announced in accordance with the storage regulations. The announcement area is located in the North Sea. Read more here.


CO2 Technology Centre Mongstad (TCM)

The Technology Centre at Mongstad (TCM) is owned by the Norwegian state, Equinor, Shell and TotalEnergies, and has been operating since 2012.

TCM is a world leading test centre for CCS technology by being the largest in the world that is open to independent testing, and has a design and instrumentation that provides opportunities for testing under various conditions. TCM currently consists of a facility for full-scale testing of amine-based technology, as a well as infrastructure of small-scale testing of various other carbon capture technologies. Both have access to flue gas of different concentration and composition.

So far, TCM has carried out tests with the suppliers Aker Carbon Capture, Alstom (now GE), Shell Cansolv, Carbon Clean Solutions, ION Clean Energy, Membrane Technology Research (MTR), Fluor, TDA Research, Mitsubishi Engineering (MHI) and RTI International.. You can read more about the facility at TCM's website here.

Technology Centre Mongstad
Technology Centre Mongstad (TCM) Foto/Photo: Helge Hansen, Equinor (Statoil)


Research and technology development

CCS requires large investments. New technologies can help lower investment and operating costs and make this climate tool relevant for additional emission sources. In Norway, funding for CCS research is provided through the CLIMIT programme. CLIMIT provides part-financing for projects that develop CCS technologies, supporting projects in all stages of the innovation chain, from research and development to demonstration. The program also provides funding for social science studies, especially those that are relevant to the development of CO2 management in Norway.

Projects that have received CLIMIT funding have delivered significant results for CCS development, both in Norway and internationally. Several technologies that will be used in Longship (Langskip), have been developed with support from CLIMIT. A good example is Aker Carbon Capture's capture technology, which will be used at the capture facility at Norcem's cement factory in Brevik. This technology has been developed over many years and in several phases with support from CLIMIT, from early trials to full-scale testing before commercialization. The product is now offered in the market as a competitive technology for capturing CO2.

CLIMIT is also an important instrument for fostering new projects that can benefit from the establishment of Longship's infrastructure for transport and storage of CO2. Many CO2 emitters are now looking at the possibility of capturing CO2 and then storing it in the North Sea. It is possible to apply for these kinds of preparatory studies through CLIMIT. In 2016, a research centre for environmentally friendly energy (FME) for CO2 management, the Norwegian CCS Research Centre (NCCS), was also established. The centre is managed by Sintef Energy and receives partial funding from the Research Council in the period 2016 to 2024.

Norwegian investment in CCS includes a wide range of activities, from research and innovation to demonstration and a full-scale project

International support and activities

For CCS to become an effective climate measure, it requires international cooperation in order to develop and commercialize new technologies. Norway therefore supports CCS projects abroad in collaboration with other countries and through existing programs and institutions.

In order for Norway to be able to store CO2 from other countries, it is necessary to have bilateral agreements with the exporting countries in addition to commercial agreements between the companies, according to international law and the London protocol. This is an area of priority for Norway. In June 2022, the Ministry of Energy was mandated by the government to initiate negotiations with relevant countries, and negotiations with a number European countries have now started. Norway is in dialogue with the European Commission and several countries to clarify the interface with existing EU regulations. Norway also has a well-established collaboration with many countries, both in and outside Europe, through various regional and international collaborations on CCS.

In addition, the USA is well advanced in CCS technology, and the Inflation Reduction Act (IRA) contains support schemes that will contribute to the realization of several projects. Norway and the USA have an MoU on energy cooperation on R&D from 2004 which includes CCS.

CCS comprises the capture, transport and storage of CO₂-emissions

Download as image (PNG)

Illustration: Gassnova

Illustation of CCS
Photo: Gassnova

Discharges to the sea

Environmental and climate considerations are an integral part of Norway’s petroleum policy. The Norwegian petroleum industry has very high environmental and climate standards compared with those in other countries.

The main components discharged to the sea are produced water, drill cuttings and residues of chemicals, and cement from drilling operations. Releases to the sea are reduced by treatment before discharge, deposition below the seabed or treatment as hazardous waste.

Produced water, which is produced as a byproduct along with oil and gas, contains oil residues in the form of droplets (dispersed oil) and other organic compounds (including oil fractions). Produced water is reinjected into a reservoir or treated, before it is discharged into the sea.

Historical data and projections of discharges of produced water, 1999-2027

Updated: 01.08.2023

Historical numbers for 1999-2022 and projections for 2023-2027

Source: Norwegian Offshore Directorate

Print illustration Download data Historical data and projections of discharges of produced water, 1999-2027 Download PDF Download as image (PNG)

High Contrast Mode

Historical data and projections of discharges of produced water, 1999-2027 – Historical numbers for 1999-2022 and projections for 2023-2027

Oil and chemicals discharged with produced water may have local effects close to oil and gas installations, and are regulated at national level through permits. Based on applications from the companies, the Norwegian Environment Agency issues permits to discharge chemicals under the Pollution Control Act. These discharges are also regulated internationally through the Convention for the Protection of the Marine Environment of the North-East Atlantic (the OSPAR Convention, in Norwegian).

Norway established a zero-discharge target for hazardous substances released as a result of petroleum activities in 1997, and this is considered to have been achieved for chemical additives.

Added chemicals include all additives and auxiliary materials used in drilling and well operations, and in production of oil and gas. As a general rule, there are to be no discharges of environmentally hazardous substances, regardless of whether they are added or occur naturally.

Discharges of chemicals are largely related to drilling activities, and the amounts discharged vary with the activity level. Drill cuttings account for most of the volume of material discharged to the sea. Chemicals that are not discharged, are deposited below the seabed or are treated as hazardous waste.

Discharges of chemicals from the petroleum activities in 2022, by source

Updated: 11.07.2023

Source: Norwegian Offshore Directorate

Print table Download data Discharges of chemicals from the petroleum activities in 2022, by source

Discharges of chemicals from the petroleum activities in 2022, by source

Acute pollution and oil spill preparedness and response

Environmental and climate considerations are an integral part of Norway’s petroleum policy, and the Norwegian petroleum industry has very high environmental and climate standards compared with those in other countries.

Acute oil spills can cause damage to fish, marine mammals, seabirds and the shoreline.

In Norway, most major oil spills have been from shipping close to the the coast line. So far, the Norwegian petroleum industry has not been the cause of any major oil spills that have resulted in environmental damage. Since Norway’s petroleum activities began, no oil spill from the industry has ever reached the shoreline.

On the Norwegian shelf, private, municipal and governmental oil spill preparedness and response services has been organised to limit the impacts of any acute pollution, should such a situation occur. Under the Pollution Control Act, operators are required to maintain a level of preparedness and response which is dimensioned to deal with acute pollution from their activities.

Oljevernberedskap
Oil spill preparedness and response

The Norwegian Coastal Administration, subordinated to the Ministry of Transport and Communications, is responsible for coordinating overall national oil spill preparedness and governmental preparedness for acute pollution. The Ministry of Climate and Environment is responsible for establishing requirements for acute pollution preparedness in municipalities and private enterprises. The Norwegian Environment Agency approves emergency response plans and ensures compliance with the requirements.

All acute oil spills from installations on the continental shelf are reported to the Coastal Administration, and the causes are investigated.

The operators are responsible for handling acute pollution resulting from their own activities, and must maintain an appropriate level of emergency preparedness and response. The Norwegian Clean Seas Association for Operating Companies (NOFO), which is owned by a number of companies that are licensees on the Norwegian shelf, has also established regional plans to reinforce ocean-going, coastal and shoreline preparedness.

NOFO administers and maintains preparedness and response resources including personnel, equipment and vessels. NOFO has five bases along the coast, situated at Stavanger, Mongstad, Kristiansund, Træna/Sandnessjøen and Hammerfest. In addition, NOFO equipment is permanently deployed on some fields. NOFO has a total of 25 offshore recovery systems, that is to say seagoing systems with oil lenses and – spillers, and conducts joint exercises every year.

Video: This is the Norwegian Clean Seas Association for Operating Companies (NOFO)

Petroleum related research and development

Research and technology development has been crucial in the successful development of oil and gas resources on the Norwegian continental shelf. A long-term commitment to research and development activities will also be vital when we embark on the next chapters of our petroleum history.

The Norwegian petroleum industry of today is very different from what it was in the late 1960s. Using a wide range of small and large technological revolutions, we are now able to produce oil and gas both more efficient and safe while at same time mitigating effects on the environment and climate.

So far, only 52 per cent of the estimated total recoverable resources on the Norwegian continental shelf has been produced. Production of the remaining resources will generate substantial value creation. In order to take advantage of this potential, new knowledge and technology must be developed. This is a cornerstone in the management of Norwegian petroleum resources.

Research and technology development in the petroleum sector

Since the beginning of Norwegian petroleum activities, research, development and demonstration of new technology has been essential in order to find solutions on how to discover, develop and produce Norwegian oil and gas both safely and efficiently. Technology is also a prerequisite for solving both current and future challenges in the petroleum industry.

The competitiveness and innovation of the petroleum industry has contributed positively to other industries in Norway, including both the maritime industry and renewable energy. There are also competence- and technology transfers to very different industries, like the heath sector and aerospace. Technology developed at the Norwegian Continental Shelf has given the Norwegian service and supply industry in a competitive advantage international markets.

The industry’s competitiveness and innovation capacity have led to major positive spin-off effects and technological applications in other industries in Norway

Favourable framework conditions have given companies incentives to carry out research and technology development in Norway. Close collaboration between oil companies, suppliers and research institutions has underpinned the successful development of new technology and solutions.

Several new challenges lie ahead. There are fewer large discoveries and developments than before. It is more demanding to produce the remaining resources from ageing fields than it was to produce oil or gas when the fields were young. All things being equal, it is thus more difficult for individual projects to finance technology development. In addition, it has become increasingly important to use technology that reduces greenhouse gas emissions.

To ensure value creation and reduced climate impact from petroleum activities in the future, it is important that oil companies, the service and supply industry and the authorities continue to invest in R&D. Such initiatives are needed to further develop the industry’s expertise and competitiveness and to maximize safe recovery of the petroleum resources on the Norwegian shelf.

The Ministry of Energy therefore encourages research, development and demonstration via research programmes where both companies and research institutions may seek funding for specific projects. These programmes are administered by the Research Council of Norway.

Organisation of research activities

In 2001, the Ministry of Energy established the strategy “Oil and Gas in the 21st Century” (OG21) in 2001 to address the challenges associated with efficient and responsible petroleum activities. The OG21 process has facilitated for oil companies, universities, research institutions, the supplier industry and the authorities to agree on a joint national technology strategy for oil and gas. The strategy has been revised several times, and was most recently revised in 2021.

The authorities encourage research and technology development primarily through legislation or other forms of regulation and through direct allocations to the Research Council of Norway. Most of these allocations go to the PETROMAKS 2 and DEMO2000 research programmes with a combined budget of NOK 200 million in 2023, and to research centres in Stavanger, Bergen and Trondheim. These programmes and centres contribute to achieving the objectives set out in the OG21 strategy and make up the Research Council's petroleum portfolio which has its own board that is responsible for allocation of funding and making sure that the desired effects and outcome can be realized.

An evaluation undertaken by Rystad Energy in 2020 shows that the programmes above have produced great value for the society as a whole.

The Norwegian Ministry of Energy's involvement in petroleum research
How the Ministry of Energy is involved in petroleum research (Source: Research Council of Norway)

PETROMAKS 2

PETROMAKS 2 provides funding to a broad range of projects, from strategic basic research at universities and research institutes to innovation projects headed by the private sector. The programme has an overall responsibility for research that facilitates the best possible management of Norwegian petroleum resources and future-oriented business development in the sector.

The programme provides funding for a number of projects carried out by small and medium-sized enterprises in order to encourage more innovation in the supplier industry. In 2023, the programme has a budget of roughly NOK 150 million. This includes funding for health, safety and environment (HSE).

The PETROMAKS 2 programme is an important funding instrument used to promote long-term research and competence-building, and is focusing strongly on education, for example by funding PhDs. The programme has a broad international interface, including North America and Brazil.

Read more about the PETROMAKS 2 programme on the Research Council website.

Examples of PETROMAKS 2 projects

The Norwegian University of Science and Technology (NTNU) has studied the observable forces when a drill string gets stuck in a borehole. The purpose was to develop a model of observations in real time for comparison against historical data from a comprehensive database, and make it possible to search for patterns and find deviations. Through such pattern recognition, causes of faults can be identified. This model has been successfully commercialised by the start-up Verdande and is used on 60 drilling rigs around the world. The technology is now being tested for other applications, such as monitoring heart patients.

Solution Seeker is a spin-off company from NTNU and develops artificial intelligence that will contribute to optimal production of oil and gas. Solution Seeker has developed the first artificial intelligence for upstream optimization of oil and gas production, which uses big-data and computer learning techniques. The system is being developed as a software product called ProductionCompass AI. It  delivers increased production by reducing bottlenecks and more energy-efficient production,  thereby reducing emissions to air per barrel of oil produced. At present, the software has been installed on five fields in the North Sea and the Norwegian Sea. Solution Seeker has been awarded a contract for application on the Libra field offshore Brazil. The technology has been developed with support from both PETROMAKS 2 and DEMO 2000.

Other examples include projects awarded funding under a joint call for proposals from the NANO2021 and PETROMAKS 2 programmes. This call resulted in two research projects that apply nanotechnology for enhanced recovery of immobile oil. The projects exemplify how industry-relevant basic research can help to boost recovery rates from fields on the Norwegian shelf.

Nanotechnology for enhanced recovery of immobile oil

An illustration of an oil-saturated geological formation, in this case sandstone, consisting of small grains of sand (white) with cavities (blue) between them where oil can be trapped. Nanotechnology can be used to enhance recovery of such immobile oil (Photo: Ingrid Anne Munz).

DEMO2000

The DEMO2000 is a tool that lies further in the innovation chain. Here the purpose is to test new technology solutions in the petroleum industry. The goal is to reduce the industry’s costs and risks by providing funding for pilot and demonstration projects. The DEMO2000 programme also functions as a collaborative arena for the petroleum and supplier companies, and is open to any Norwegian business that supplies technology to petroleum companies on the Norwegian shelf.

The programme issues two calls for proposals annually and provides funding to projects that satisfy the requirements for the technology strategy set out in OG21. The programme has a budget of roughly NOK 50 million for 2023.

Read more about the DEMO2000 programme on the Research Council website.

Examples of DEMO2000 projects

A large proportion of DEMO2000 projects involve testing of new subsea technology. One such project, concluded in 2013, was Seabox, a system for purifying and desalinating seawater for injection in reservoirs to increase pressure. The entire technology is subsea-based and may significantly improve recovery from limestone reservoirs. At the same time, a subsea solution will be more energy-efficient and cost-effective than modifying a platform or constructing a new one.

EMPIG AS, in collaboration with industry partners, has developed an Always-clean Cooling System (ACS) that cools a multi phase flow from a producing well/field below the temperature for hydrate and wax formation. The concept is known as Cold Flow. A realization of this innovation will result in reduced costs for oil and gas production in existing fields, open fields further from existing infrastructure and enable connection to existing tie-in hubs. For new areas of development, where no infrastructure is in place, the technology has the potential to transport the resources to shore, eliminating the need for offshore production facilities. ACS will also significantly reduce the environmental footprint from oil and gas production.

Eelume is a disruptive technology for subsea inspection, maintenance and repair (IMR). Eelume vehicles are basically self-propelled robotic arms whose slender and flexible body can transit over long distances and carry out IMR in confined spaces not accessible by conventional underwater vehicles. The robot is engineered to live permanently under water, where they can be mobilized 24/7 regardless of weather conditions. A continuous IMR capability near the subsea installations without the need for surface vessels means greener, safer and less costly subsea operations.The concept is of interest to other industries as well, such as offshore wind farms and fish farming.

Seabox, a system for purifying and desalinating seawater for injection in reservoirs to increase pressure (Source: National Oilwell Varco)

PETROSENTER

(Research centres for petroleum activities)

The objective of research centres for petroleum activities is to solve defined and given challenges related to the utilisation of petroleum resources and reducing greenhouse gas emissions. The research centres consist of selected research environments and companies, and involves a long-term and targeted research effort at a high international level.

Low Emission Research Centre

The centre for low emission technology was established in 2019. In collaboration with the industry, their goal is to develop solutions to reduce greenhouse gas emissions from the Norwegian continental shelf, with a target of 50 % reduction by 2030 and net zero by 2050. LowEmission’s work spans from technology and solutions related to energy supply and consumption to greenhouse gas reduction from petroleum production offshore. The centre is located in Trondheim and managed by SINTEF and NTNU.

Centre for Sustainable Subsurface Resources – CSSR

A research centre at NORCE in Bergen was established in 2022 to increase knowledge on how reservoirs powered by renewable energy can be utilised better and more energy efficient. It also aims to obtain a new understanding on how the subsoil can be used and contribute to low emission energy solutions. The centre will, in collaboration with the industry, work to find solutions based on areas where Norway has world-leading expertise, such as reservoir technology, simulation and digitalisation.

National Centre for Sustainable Subsurface Utilisation of the Norwegian Continental Shelf – NCS2030

NCS2030 is led by the University of Stavanger and was established in 2022. Like the other centres, reduction of greenhouse gas emissions is an integral part of their activities. Its objective is to contribute to energy-efficient utilisation of the continental shelf, with a goal of net zero emissions from production. This is partially done by improving the understanding of hydrogen and CO2 storage, geothermal energy and efficient petroleum extraction. NCS2030 will also study alternative usage of emptied petroleum reservoirs, and how these can contribute in the transition to a low emission society

Read more about the PETROSENTER centres on the Research Council website.

Other research centres

The Research Council has launched several Centres for Research-based Innovation (SFI) as well as Centres of Excellence (SFF). A number of these centres carry out petroleum-relevant research, including:

  • Centre for Autonomous Marine Operations and Systems (AMOS) at NTNU
  • Centre for Arctic Gas Hydrate, Environment and Climate (CAGE) at UiT the Arctic University of Norway.

The SFI centres can receive funding for up to eight years, and the SFF centres can receive funding for up to ten years. Some of these are also highly relevant in the context of research for the petroleum industry, such as:

  • Subsea production and processing (SUBPRO) at NTNU
  • Centre for Offshore Mechatronics at the University of Agder
  • Centre for Integrated Remote Sensing and Forecasting for Arctic Operations at UiT the Arctic University of Norway.

In 2020 funding was allocated for two new SFI centres that are dealing with research in areas of great importance to the petroleum sector: Plug and abandonment (P&A) and digital technologies for wells and drilling operations:

  • Swipa (Subsurface Well Integrity, Plugging and Abandonment) at SINTEF
  • DigiWells: Digital Well Center for Value Creation, Competitiveness and Minimum Environmental Footprint at NORCE

Read more about the SFI and SFF schemes on the Research Council website.

The petroleum resources

Petroleum resources on the Norwegian continental shelf have been estimated to 15.6 billion standard cubic metres of oil equivalents. 55 per cent of the total discovered and undiscovered petroleum resources on the Norwegian shelf have so far been produced and sold.
Picture from Kvitebjørn

Resource accounts for the Norwegian shelf as per 31.12.2023

A total of 8.5 billion Sm³ oil equivalents (o.e.) have been sold from the Norwegian continental shelf. Over the last ten years, more gas than oil has been sold measured in o.e. In the period 1985-2005, oil production was significantly higher than gas production. The proven resources have increased by 93 million Sm³ of o.e. compared with 2022.

Oil and gas resources are discovered, and discoveries are developed as fields if they are economically and technologically viable, and the oil and gas is produced and sold. This results in dynamic resource accounts that change from year to year. Resources is a general term for all oil and gas that can be recovered. Resources are classified according to maturity, which measures how far along they are in the planning process leading to production. The primary classifications are reserves, contingent resources and undiscovered resources. Read more about the resource classification system.

Total resources

The Norwegian Offshore Directorate's resource accounts as per 31 Dec. 2023 show that the overall resource volume (including what has been sold and delivered) on the Norwegian shelf is about 15.6 Sm³ billion (GSm³) of oil equivalents (o.e.). This is a reduction of 191 million Sm³ (MSm³) of o.e. in 2023 compared with the previous year, and is the largest reduction since 2010. The proven resources have increased by 93 MSm³ of o.e. compared with 2022.

Total recoverable petroleum resources on the Norwegian continental shelf as of 31.12.2023

Oil and condensate are listed in million standard cubic metres (Sm³). NGL is listed in million tonnes, and gas is listed in billion standard cubic metres. The conversion factor for NGL in tonnes to Sm³ is 1.9. Total oil equivalents are listed in million Sm³ o.e., 1000 Sm³ gas = 1 Sm³ o.e.

Source: Norwegian Offshore Directorate

Print table Download data Total recoverable petroleum resources on the Norwegian continental shelf as of 31.12.2023

Total recoverable petroleum resources on the Norwegian continental shelf as of 31.12.2023 – Oil and condensate are listed in million standard cubic metres (Sm³). NGL is listed in million tonnes, and gas is listed in billion standard cubic metres. The conversion factor for NGL in tonnes to Sm³ is 1.9. Total oil equivalents are listed in million Sm³ o.e., 1000 Sm³ gas = 1 Sm³ o.e.

55 per cent of the expected recoverable resources on the shelf have been produced, and 22 per cent of the overall resources have yet to be proven. Download all tables associated with the Resource accounts for the Norwegian shelf as per 31 Dec. 2023 and the report for this year's resource accounts from the Norwegian Offshore Directorate's website.

Petroleum resources and uncertainty in the estimates as per 31 Dec. 2023

Download as image (PNG)

The figure in each column shows the expected recoverable petroleum, while the slanted line shows the uncertainty in the estimates; low estimate on the left and high estimate on the right (Source: Norwegian Offshore Directorate)

Petroleum resources and uncertainty in the estimates at 31 December 2023
Source: Norwegian Offshore Directorate

Discovered resources

In the Norwegian Offshore Directorate’s resource classification system, oil and gas resources transition into reserves once the operator has submitted a plan for development and operation (PDO) or decided to implement a measure optimising recovery that does not require a PDO. Discoveries are classified as fields once an approved plan for development is available. There are currently more than 100 fields in production, under development, or with plans for redevelopment. The Troll and Johan Sverdrup fields have the largest remaining reserves on the Norwegian shelf, with 605 billion Sm3 of gas and 226 million Sm3 of oil, respectively.

Troll A platform
Troll A platform. Troll is the field with the most remaining reserves on the Norwegian continental shelf. Photo: Øyvind Hagen, Equinor

The overall remaining reserves amount to 950 MSm³ of oil and 1366 GSm³ of gas. This year's resource accounts show a slight growth in gross reserves, that means reserves before the total production is subtracted. The growth in gross oil reserves is 6 MSm3 and in gross gas reserves 17 GSm3. Total production in 2023 was 233 MSm3 o.e.

Fifteen new discoveries were made in 2023. Twelve of the discoveries were made in the North Sea, two in the Norwegian Sea and one in the Barents Sea. At the end of 2023, the discovery portfolio consisted of 79 discoveries. Of these discoveries, the largest are 7324/8-1 (Wisting) in the Barents Sea, 6406/9-1 Linnorm in the Norwegian Sea and 35/2-1 (Peon) in the North Sea.

A low number of PDOs and PDO exemption applications were submitted in 2023. This also explains the modest increase in reserves compared with the previous Resource Accounts.

Contingent Resources

Contingent resources are proven oil and gas for which a production decision has not yet been made. Petroleum volumes in potential improved recovery projects are included in this category. The growth in the contingent resources category comes from both new discoveries and from changed resource estimates and new opportunities in fields and discoveries. Decisions are made every year to develop some of the contingent resources. They are then transitioned over to the reserves category.

At year-end, the contingent oil resources in fields were 356 MSm³, which is an increase of 16 MSm³ from the previous year. Contingent gas resources amounted to 291 GSm³, and this is an increase of 31 GSm³ compared with the previous year. The increase is related to several future projects under consideration by the licensees.

Contingent resources in discoveries amount to 261 MSm³ of oil and 233 GSm³ of gas. The total volume for undeveloped discoveries has been increased by 23 MSm3 of o.e. compared with last year's accounts. This increase results from exploration activity in 2023.

More than 60 per cent of all undiscovered resources are located in the Barents Sea

Undiscovered resources

Undiscovered resources are volumes of petroleum that we assume could be recovered from deposits not yet proven through drilling. The estimates for undiscovered resources in areas opened for petroleum activities are updated on an annual basis. The update is based on assessments taking into consideration the previous year's exploration results, new studies, as well as relevant information from the companies.

Undiscovered resources are estimated at 3.5 billion Sm3 of o.e., which is a reduction of 285 MSm3 of o.e. compared with the previous year. Unproven resources make up about 22 per cent of the overall remaining resources on the Norwegian continental shelf. For more detailed estimates and distribution of undiscovered resources in each sea area, see the article Resources per sea area.


Photo: Ministry of Energy

Resources per sea area

The three areas North Sea, Norwegian Sea and Barents Sea are different with regard to geology, resource base, maturity and scope of infrastructure, distance and knowledge. Large parts of the expected remaining resources in the Barents Sea have yet to be proven.

Remaining Resources

The North Sea holds about 42 per cent of the remaining resources. The distribution of the rest of the resources shows that there is 20 per cent left in the Norwegian Sea and 38 per cent in the Barents Sea.

There has been petroleum activity in the North Sea since 1965. The Norwegian Sea and the Barents Sea (areas north of the 62nd parallel) were opened for petroleum activities in 1980. The remaining resources and distribution between discovered and undiscovered resources in opened and unopened areas, respectively, therefore differ between the three ocean areas.

Remaining petroleum resources by sea area as per 31 Dec. 2023

Download as image (PNG)

Distribution of remaining liquids resources (green) and gas resources (red) by sea area and resource class (Source: Norwegian Offshore Directorate)

Distribution of remaining liquid and gas resources per sea area and resource class
Source: Norwegian Offshore Directorate

In the North Sea, most of the oil and gas is classified as reserves, which means that they have approved plans for production. In the Barents Sea, most of the oil and gas resources have the status of undiscovered resources. Vast areas in the Barents Sea have not been opened for petroleum activity as yet, and this is where we find the greatest expected value for undiscovered resources.

Undiscovered Resources

Undiscovered resources are volumes of petroleum that we assume could be recovered from deposits that have yet to be proven through drilling. The estimates for undiscovered resources in areas opened for petroleum activities are updated on an annual basis. The update is based on assessments taking into consideration the previous year's exploration results, new studies, as well as relevant information from the companies.

In areas that have not been opened for petroleum activities, the estimates are only updated if new data has been acquired in the area, providing significant new information.

Undiscovered petroleum resources in the sea areas

Download as image (PNG)

Distribution of undiscovered liquids (green) and gas (red) in the various sea areas, with range of uncertainty (Source: Norwegian Offshore Directorate)

Undiscovered resources by area as of 31 December 2023
Source: Norwegian Offshore Directorate

North Sea

The North Sea is the powerhouse of the Norwegian petroleum activities, with 67 producing fields at year-end. Two new fields came on stream in 2023: Tommeliten A and Breidablikk. Five fields were shut down: Flyndre and Heimdal including its tied-in fields Atla, Skirne and Vale. Twelve new discoveries were made in 2023.

The resource accounts for the North Sea show that 185 million Sm3 (MSm3) of oil equivalents (o.e.) were sold and delivered from this part of the Norwegian continental shelf over the past year. At year-end, the reserves amounted to 170 MSm3 of o.e.

The estimate for undiscovered resources in the North Sea is 610 million Sm3 of recoverable o.e. This is distributed between 395 MSm3 of oil and 215 GSm3 of gas.

Even if one cannot rule out that larger discoveries could be made in the North Sea, we expect that the majority of discoveries will be relatively small. The average discovery size in the North Sea over the last five years is 3.5 MSm3 of recoverable o.e.

Total recoverable petroleum resources in the North Sea as of 31.12.2023

Oil and condensate are listed in million standard cubic metres (Sm³). NGL is listed in million tonnes, and gas is listed in billion standard cubic metres. The conversion factor for NGL in tonnes to Sm³ is 1.9. Total oil equivalents are loisted in million Sm³ o.e., 1000 Sm³ gas = 1 Sm³ o.e.

Source: Norwegian Offshore Directorate

Print table Download data Total recoverable petroleum resources in the North Sea as of 31.12.2023

Total recoverable petroleum resources in the North Sea as of 31.12.2023 – Oil and condensate are listed in million standard cubic metres (Sm³). NGL is listed in million tonnes, and gas is listed in billion standard cubic metres. The conversion factor for NGL in tonnes to Sm³ is 1.9. Total oil equivalents are loisted in million Sm³ o.e., 1000 Sm³ gas = 1 Sm³ o.e.
Oseberg A
Oseberg A platform in the North Sea. Photo: Harald Pettersen, Equinor

Norwegian Sea

There are 23 producing fields in the Norwegian Sea. Two new fields started production, Bauge and Fenja, and two new discoveries were made in the Norwegian Sea in 2023. The largest discovery in the Norwegian Sea was proven in 2005, 6406/9-1 Linnorm.

The resource accounts for the Norwegian Sea show that 48 MSm3 of o.e. were sold and delivered from this part of the Norwegian shelf over the past year. At year-end, the reserves amounted to 466 MSm3 of o.e. The estimate for undiscovered resources in the Norwegian Sea is 725 MSm3 of recoverable o.e. This is distributed between 350 MSm3 of oil and 375 GSm3 of gas.

The average discovery size in the Norwegian Sea has increased over the past five years and is now about 4.5 MSm3 of recoverable o.e. The resource estimates for the Norwegian Sea also include the unchanged resource volumes in Lofoten-Vesterålen and in the area around Jan Mayen. These make up approximately 33 per cent of the total estimates.

Total recoverable petroleum resources in the Norwegian Sea as of 31.12.2023

Oil and condensate are listed in million standard cubic metres (Sm³). NGL is listed in million tonnes, and gas is listed in billion standard cubic metres. The conversion factor for NGL in tonnes to Sm³ is 1.9. Total oil equivalents are listed in million Sm³ o.e., 1000 Sm³ gas = 1 Sm³ o.e.

Source: Norwegian Offshore Directorate

Print table Download data Total recoverable petroleum resources in the Norwegian Sea as of 31.12.2023

Total recoverable petroleum resources in the Norwegian Sea as of 31.12.2023 – Oil and condensate are listed in million standard cubic metres (Sm³). NGL is listed in million tonnes, and gas is listed in billion standard cubic metres. The conversion factor for NGL in tonnes to Sm³ is 1.9. Total oil equivalents are listed in million Sm³ o.e., 1000 Sm³ gas = 1 Sm³ o.e.
Skandi Mongstad, supply vessel at Norne
Norne FPSO in the Norwegian Sea. Photo: Harald Pettersen, Equinor

Barents Sea

There are two producing fields in the Barents Sea. One new discovery was made in this sea area in 2023. The largest discovery in the Barents Sea was proven in 2013, 7324/8-1 (Wisting).

The resource accounts for the Barents Sea show that 9 MSm3 of o.e. were sold and delivered from this part of the Norwegian shelf over the past year. At year-end, the reserves amounted to 260 MSm3 of o.e. The estimate for undiscovered resources in the Barents Sea is 2145 MSm3 of recoverable o.e. This is distributed between 1100 MSm3 of oil and 1045 GSm3 of gas. Exploration in the Barents Sea over the past five years has given mixed results. Exploration close to infrastructure has given good results, while wells in new areas were less successful. The average discovery size in this period is about 4.3 MSm3 o.e.

In the Barents Sea, 54 per cent of the resources are located in areas that have not been opened for petroleum activities, primarily in the Barents Sea North. This is the area with the greatest likelihood of making major discoveries on the Norwegian shelf. There are considerable uncertainties associated with the estimates in these areas.

Total recoverable petroleum resources in the Barents Sea as of 31.12.2023

Oil and condensate are listed in million standard cubic metres (Sm³). NGL is listed in million tonnes, and gas is listed in billion standard cubic metres. The conversion factor for NGL in tonnes to Sm³ is 1.9. Total oil equivalents are listed in million Sm³ o.e., 1000 Sm³ gas = 1 Sm³ o.e.

Source: Norwegian Offshore Directorate

Print table Download data Total recoverable petroleum resources in the Barents Sea as of 31.12.2023

Total recoverable petroleum resources in the Barents Sea as of 31.12.2023 – Oil and condensate are listed in million standard cubic metres (Sm³). NGL is listed in million tonnes, and gas is listed in billion standard cubic metres. The conversion factor for NGL in tonnes to Sm³ is 1.9. Total oil equivalents are listed in million Sm³ o.e., 1000 Sm³ gas = 1 Sm³ o.e.

Classification of petroleum resources

"Resources" is a collective term for all recoverable volumes of petroleum. The resources are classified according to their maturity with regard to development and production. The main categories are reserves, contingent resources and undiscovered resources. Volumes that are produced and sold constitutes the historic production.

Oil and gas are produced through industrial projects. Discoveries and fields may be developed in stages, with a number of different projects at different stages of maturity with regard to development and production.

The classification system used by the Norwegian Petroleum Directorate is an important tool for maintaining an overview of the volume of petroleum on the Norwegian shelf. Only recoverable petroleum resources are classified, and the system has been developed in order to follow changes in the resource base by following discoveries, fields and projects through various phases. The system classifies the petroleum resources in the different projects according to their maturity.

The Norwegian Offshore Directorate's resource classification

Download as image (PNG)

The resources are classified according to their maturity with regard to development and production.

Source: Norwegian Offshore Directorate

The classification system has three classes: reserves, contingent resources and undiscovered resources. Sub-classes (resource classes) are defined by maturity. Resources is a collective term for all recoverable volumes of petroleum, and reserves are a particular type of resources. Historic production means all the oil and gas that has been produced, sold and delivered.

Reserves are the volumes of oil and gas that the licensees have decided to recover, and are classified as resource class (RC) 1 to 3. Contingent resources have been proven, but no decision has been made regarding their production. This class also includes resources in projects to improve recovery, and resources that are unlikely to be produced. The letters F and A are used to distinguish between development of new discoveries and deposits (F) and measures leading to improved recovery of petroleum from a deposit (A). F stands for "first” and A for “additional”. Contingent resources are classified in resource class 4 to 7.

Undiscovered resources are estimated quantities of oil and gas that are probably present but that have not yet been proven by drilling. These are classified in resource class 8 and 9.

Link to the Norwegian Offshore Directorate's resource classification system.

How is petroleum formed?

Oil and gas are formed from organic material mainly deposited as sediments on the seabed and then broken down and transformed over millions of years. If there is a suitable combination of source rock, reservoir rock, cap rock and a trap in an area, recoverable oil and gas deposits may be discovered there.

Most of the oil and gas deposits on the Norwegian shelf originate from a thick layer of black clay that currently lies several thousand metres under the seabed.

The black clay is a source rock, which means a deposit containing significant quantities of organic residue. The clay was deposited around 150 million years ago at the bottom of a sea that covered much of present-day northwestern Europe. Much of the seabed here was dead and stagnant, while the upper water layers were teeming with life.

As the microscopic phytoplankton died, they sank to the bottom and accumulated in large quantities in the oxygen-free sediments. Over time, they were buried deeper and subjected to a long process of chemical conversion by bacterial decomposition and maturing under a thickening pile of sediment. This caused the formation of liquid and gaseous hydrocarbons in the source rock.

One of the products of anaerobic decomposition of organic matter is kerogen, which at high temperature and pressure slowly generates oil and gas. On the Norwegian continental shelf, the temperature rises by about 25 °C per kilometre of depth. After more than a hundred million years of erosion and sedimentation, the source rock may be buried under several kilometres of clay and sand deposits. Oil is generated when the kerogen temperature reaches 60-120 °C; at higher temperatures, it is mainly gas that is generated.

As oil and gas form, they seep out of the source rock. Because hydrocarbons are lighter than water, the oil and gas migrate upwards in porous water-bearing rock. Oil and gas migration takes thousands of years, and may extend over tens of kilometres until it is stopped by impermeable layers of rock, or the oil or gas leaks out into the sea.

Reservoir rocks are porous and always saturated with water, oil and gas in various combinations. Most of Norway’s petroleum resources are trapped in reservoir rocks deposited in large deltas formed by rivers that ran into the sea during the Jurassic Period.

The main reservoirs of the Gullfaks, Oseberg and Statfjord fields are in the large Brent delta that formed in the Jurassic. There are also large reservoirs in sand that was deposited on alluvial plains during the Triassic Period (the Snorre field), in shallow seas in the Late Jurassic (the Troll field) and as subsea fans during the Paleogene Period (the Balder field). In the southern part of the North Sea, thick layers of chalk composed of microscopic calcareous skeletons of plants and animals form an important reservoir rock, as in the Ekofisk Field.

The geological timeline

Download as image (PNG)

Source: Norwegian Offshore Directorate

The geological timeline
Source: Norwegian Offshore Directorate

Mudrocks and other impermeable deposits influence migration routes from the source rock to the reservoir. In addition, impermeable rock has to be present to stop petroleum escaping from reservoir rock. Impermeable rock that forms a seal over reservoir rocks is called cap rock. In addition, the configuration of the reservoir rocks must be such that the oil collects in a trap.

If there is a suitable combination of source rock, reservoir rock, cap rock and a trap in an area, recoverable oil and gas deposits may be discovered there.

Illustration of how oil and gas reservoirs are formed

Download as image (PNG)

The illustrated elements have to be in place in order to find producible oil and gas reservoirs (Source: Norwegian Offshore Directorate)

Illustration of how oil and gas reservoirs are formed
Source: Norwegian Offshore Directorate

Exploration

Before oil and gas can be produced, the resources have to be proven through exploration activities. About half of all the remaining resources on the shelf is undiscovered. The authorities' exploration policy is thus an important element of long-term resource management.
Transocean Leader on the Aldous Major South prospect (PL 265) in the North Sea

Exploration policy

Before oil and gas can be produced on the Norwegian continental shelf, the resources have to be proven through exploration activities. The authorities’ exploration policy is thus an important element of long-term resource management on the Norwegian continental shelf.

The Norwegian licensing system

On the Norwegian continental shelf, there are two equal types of licencing rounds that will ensure an efficient and rational exploration of the entire Norwegian continental shelf. Those are awards in predefined areas (APA) for mature parts where the knowledge is highest and numbered licensing rounds in other areas. This ensures that all parts of the Norwegian continental shelf can be adequately explored. All areas that are open and accessible for petroleum activity may be announced in a licencing round.

Awards in predefined areas (APA)

On the majority of the opened areas of the Norwegian continental shelf, there has been petroleum activity for several decades. Understanding of the geology is good and there is a well-developed infrastructure in place with more planned. These areas are covered by APA-rounds. The system of awards in predefined areas (APA) was introduced for the most well-documented parts of the continental shelf in in 2003. In order to ensure good resource management and high value creation, it is important to utilize the infrastructure well over time. The APA-rounds help facilitate the identification of profitable resources while the infrastructure is in place.

In the APA-system, the most well-known acreage on the shelf is designated as predefined exploration areas, and companies can apply for licences for all acreage not already covered by licences. As new areas on the continental shelf is explored, the APA-areas are expanded, but no acreage is withdrawn. Proposals for expanding APA-acreage are submitted to public consultation. Licensing rounds in mature areas follow a fixed annual cycle, and so far, 21 rounds have been initiated (APA 2003–2023). There is no nomination step in APA-rounds.

The APA-system was introduced to ensure that profitable resources in more well-known areas are proven and recovered before existing infrastructure is shut down.

Numbered licensing rounds

The numbered licensing rounds consist of open and available areas which are not included in the predefined areas (APA-areas). In these less explored areas the uncertainty of results of exploration activity is higher and a step by step approach for exploration is used by the companies to achieve good resource management. The purpose of step by step exploration is to cover a larger area by utilizing few exploration wells and thus preventing unnecessary drilling of dry exploration wells.

Numbered licensing rounds have been held since 1965. Numbered rounds starts with inviting oil companies being given the opportunity to nominate blocks that they want advertised, so that they can carry out exploration activities there. On the basis of the authorities’ assessments, and the input form the oil companies of the nominations, a proposed announcement is submitted for public consultation. The advantages of step by step exploration are also taken into account in the proposal. Finally, the Ministry of Energy announces the round.

Picture from Maersk Developer
Drilling – from the rig Maersk Developer. Photo: Helge Hansen, Equinor (Statoil)

Award of licences

Companies may apply for a licence individually or as a group. Companies intending to submit a group application conclude a cooperation agreement that remains in force up to the time of application.

The Ministry of Energy awards production licences to the companies or groups that submit the strongest applications on the basis of fair, objective and non-discriminatory criteria that are announced in advance. The Ministry of Energy also designates an operator for each joint venture to be responsible for operational activities authorized by the licence. A production licence is valid for an initial period of up to 10 years, which is reserved for exploration activity.

Licensing position for the Norwegian continental shelf

Download as image (PNG)

The map gives an overview of the current status of the Norwegian continental shelf. The green areas have been opened for petroleum activity by the Storting (Norwegian parliament). The yellow areas have also been opened, but are subject to special arrangements as described in the white paper the white paper no. 20 (2019-2020). The areas outlined in red are covered by the system of awards in predefined areas (APA). (Source: The Norwegian Offshore Directorate)

Area status of the Norwegian continental shelf
Source: Norwegian Offshore Directorate

Exploration in APA-areas

All areas open for petroleum activity which are not subject to any special restrictions on new area allocation, can be included in the APA-area. Professional assessments determine when areas are included in the APA-area.

The APA-areas are the most explored areas on the Norwegian continental shelf and the geology is well known and there is well-developed or planned infrastructure. Good understanding of the geology combined with data coverage makes it likely for new discoveries to be made. Due to the fact that the largest discoveries normally takes place at the beginning of exploration of a petroleum province, major discoveries is less likely to be made. However, there are exceptions, such as the major Johan Sverdrup oil field, discovered in the North Sea.

It is important to prove and recover resources in APA-areas while existing infrastructure is operating. If this is not done, new discoveries may be too small to justify the building of more infrastructure, and resources that could have been profitable may remain unrecovered.

Additional resources in the area surrounding a planned or producing field may increase profitability, for example by extending the lifetime of the main fields so that more resources can be recovered. The same will apply to any discoveries in the area and further exploration activity

The authorities’ exploration policy is an important element of Norway’s long-term resource management

The authorities have therefore adapted their licensing policy for the most known parts of the Norwegian continental shelf to encourage production of resources where timing is critical. The introduction of the APA-system in 2003 was part of this strategy. Another measure was to open the Norwegian continental shelf to companies that see commercial opportunities in these resources.

The map above shows the acreage announced in the APA 2023 round. The APA-area is gradually expanded as new areas are explored, but no acreage is withdrawn. APA-licensing rounds are held every year.

The authorities consider it important that companies work their licences actively. A production licence therefore includes a mandatory work program, and a licence only covers the area that the licensees have specific plans to explore.

If a group of licensees no longer wishes to explore the area for which it has a production licence, the area must either be transferred to companies that are willing to continue with the work program, or be relinquished. Other companies that see different possibilities in the geology may then determine to continue to work the licence or apply for a licence for the relinquished acreage. This leads to circulation of acreage and more efficient exploration.

Exploration in other areas

The parts of the Norwegian shelf that are currently not included in the APA-area include for the most part the north and east parts of the Barents Sea, some small areas of the Norwegian Sea and in the North Sea.

In areas, there has been less exploration and thus limiting the knowledge of the geology. With less exploration wells the technical challenges may be greater in these areas, and there is a lack of infrastructure.

The rules on relinquishment of  production licenses awarded through numbered licensing rounds were altered to make them identical to those that apply in APA-areas. Work program and area allocated are adapted to the relevant areas, regardless of whether the allocation took place during an APA-round or a numbered licensing round.

The 25th licensing round was sent on public consultation in June 2020, and was subsequently announced in November 2020. The licencing round includes a total of 9 areas, 8 in the Barents Sea and one in the Norwegian Sea. In June 2021, it was awarded a total of four licenses, divided among one in the Norwegian Sea and three in the Barents Sea.

Area fees

The system of area fees provides an incentive for companies to move from discoveries to development and production in the areas for which they have been awarded licences. The Petroleum Act (section 4-10, first paragraph) provides the legal authority for area fees, which are payable each year per square kilometre of the area covered by a production licence.

No area fee is payable for areas that are being actively explored or where there is production. This means that companies do not pay an area fee during the initial period, while they are following the mandatory work programme. Companies can also apply for exemption from the area fee if they submit a plan for development and operation (PDO) or if extra exploration wells are drilled in addition to those required under the work programme. It is also possible to apply for exemption if there is a lack of infrastructure in an area or if there is substantial ongoing work within the licence. The current rates for area fees are NOK 38 000 per km2 for the first year, NOK 76 000 per km2 for the second year and NOK 153 000 per km2 each year thereafter.

Unopened areas

There are still large areas of the Norwegian continental shelf that have not been opened for oil and gas activities by the Storting. These include the Barents Sea North, the north-eastern part of the Norwegian Sea (Troms II, Nordland VII and parts of Nordland IV, V and VI) and the Skagerrak, plus the area around Jan Mayen.

Before licensing rounds can be held for these areas, the Storting has to make an official decision to open them. Such decisions are based on a combination of impact assessments and resource mapping. An impact assessment includes an evaluation of the possible economic, social and environmental impacts of the activities. Resource mapping involves surveying the geology of the area to identify its resource potential. The Storting is also considering the framework for petroleum activities in open areas in connection with the management plans for Norwegian sea areas.

Helicopter deck
Photo: Morten Berentsen / MBMultimedia.no

New discoveries – effective use of infrastructure

Over NOK 6 000 billion at the current monetary value has been invested in the Norwegian continental shelf. The infrastructure financed by these investments is used to produce and transport oil and gas and makes it possible to produce further resources cost effectively.

Declining production from a field releases infrastructure capacity, which can be used by tying in new resources to the same infrastructure. In some cases, new smaller deposits can only be profitably developed and produced by using existing infrastructure.

Discoveries and the subsequent development of resources close to existing infrastructure can result in substantial value creation for Norwegian society. The authorities encourage cooperation between companies, and there are a number of effective area forums on various parts of the Norwegian shelf.

In order to promote the effective use of existing infrastructure, including platforms and pipelines, the Ministry of Energy adopted regulations relating to the use of facilities by others (the Third-party Access Regulations), which entered into force in 2006.

The objective of the regulations is to promote the efficient use of facilities and thereby provide incentives for licensees to conduct exploration and production activities close to existing infrastructure. To this end, they set out a framework for negotiations and for tariffs and conditions in agreements on the use of facilities by others. The regulations do not alter the principle that negotiating good solutions is the task of the commercial actors themselves.

Exploration activity

In 2023, exploration activity was at the same level as in 2022. A total of 33 exploration wells were completed and 15 discoveries were made on the Norwegian continental shelf. The discoveries have a preliminary total estimate of 52 million standard cubic metres of recoverable oil equivalents. This gives the same resource growth as the previous year. Discoveries in the last years consisted of somewhat more gas than oil.

New commercially viable discoveries are necessary to ensure the continuation of regular activities in the near future. This means maintaining exploration activity at a high level in all sea areas. It will also be important to make new discoveries in mature areas while established infrastructure is still in place and operational. Effective use of existing infrastructure makes it more likely that socio-economically profitable resources will be produced.

Undiscovered resources by sea area

The Storting (Norwegian parliament) has opened most of the North Sea, the Norwegian Sea and the Barents Sea South (including Southeast) for petroleum activities.

The Norwegian Offshore Directorate has estimated the undiscovered resources on the Norwegian shelf at approximately 3.5 billion standard cubic metres of recoverable oil equivalents (Sm3 o.e.). This means that about half of all remaining resources on the shelf have yet to be proven.

About half of all remaining resources on the shelf are still undiscovered

Undiscovered resources are divided as follows between the different sea areas: 18 per cent in the North Sea, 21 per cent in the Norwegian Sea and 61 per cent in the Barents Sea.

Undiscovered resources by sea area

Download as image (PNG)

The figures in each column show expected recoverable volumes not yet discovered at year end. The uncertainty in the estimates is shown in the slanted line; low estimates on the left, high estimates on the right (Source: Norwegian Offshore Directorate).

Undiscovered resources by area as of 31 December 2023
Source: Norwegian Offshore Directorate

Resource growth by sea area

The most attractive areas are explored first and the largest discoveries, with a few exceptions, were proven early on the Norwegian continental shelf. This is illustrated in the figure below as large increases representing Ekofisk, Statfjord and Troll, and then the curve gradually levels off. This is a normal development compared with other petroleum provinces. Ormen Lange and Johan Sverdrup prove that it is still possible to make large discoveries on the Norwegian shelf. The sea areas on the shelf have been explored to varying degrees.

Accumulated resources on the Norwegian continental shelf, 1966-2022

Download as image (PNG)

Source: Norwegian Offshore Directorate

Accumulated resources on the Norwegian continental shelf, 1966-2022
Source: Norwegian Offshore Directorate

About a total of 1230 wildcat wells have been drilled on the Norwegian shelf. In the North Sea, 805 wildcat wells have been drilled since 1966, and the vertical jumps in the figure show that the largest discoveries were made in an early exploration phase, such as Statfjord (1974) and Troll (1979). After this, the resource growth curve levels off somewhat; in other words, the discoveries become smaller, until we see a new jump with the Johan Sverdrup discovery in 2010. After Johan Sverdrup, the graph shows steady but moderate resource growth in the North Sea.

In the Norwegian Sea, exploration activity started in 1980, and 285 wildcat wells have been drilled up to now. Here too, the largest discoveries such as Heidrun and Ormen Lange were proven relatively early in the exploration phase, in 1985 and 1997, respectively. After Ormen Lange, there has been steady growth in resources, but with significantly smaller discoveries. Among the largest discoveries made in recent years are 6507/4-2 S (Dvalin Nord) in 2021, 7122/9-1 (Lupa) in 2022, and 35/10-10 S in 2023.

In the Barents Sea, exploration activity also started in 1980, but the area has considerably fewer wildcat wells (140) compared with the Norwegian Sea. The largest discovery so far is Snøhvit, dicovered in 1984. The graph shows that there have not been many large discoveries in the early exploration phase, as was the case in the North Sea and the Norwegian Sea. More than 60 exploration wells have been drilled in the last 10 years, with significant discovery success early in the period. The largest discovery in the last 10 years is 7324/8-1 (Wisting) in 2013.

Cumulative resource growth per sea area

Download as image (PNG)

Source: Norwegian Offshore Directorate

Cumulative resource growth per sea area
Source: Norwegian Offshore Directorate

Resource growth in recent years

Both large and small exploration companies have contributed to the strong resource growth in the last few years. Resource growth was particularly strong in 2010 due to the Johan Sverdrup discovery. This is the largest discovery in recent times and the fifth largest ever made on the Norwegian continental shelf. It was made in an area that has been regularly explored since the mid-1960s, and shows the considerable potential in exploration of mature areas.

A total of 33 exploration wells were completed on the Norwegian continental shelf in 2023. More wells were drilled in the North Sea (26) than in 2022, while fewer wells were drilled in the Norwegian Sea (6) and the Barents Sea (1). Based on the companies’ plans, some more exploration wells will be drilled in 2024.

There are two types of exploration wells: wildcat and appraisal wells. Wildcat wells are drilled to explore whether there are hydrocarbon deposits under the seabed. When a discovery has been made, appraisal wells may be drilled to obtain more data about the extent and size of the discovery. Of the 33 exploration wells completed, 21 were wildcat wells and 12 were appraisal wells. It is expected that also in 2024, most of the wells will be wildcat wells.

Exploration wells spudded on the Norwegian continental shelf, 1970-2023

Updated: 11.01.2024

Source: Norwegian Offshore Directorate

Print illustration Download data Exploration wells spudded on the Norwegian continental shelf, 1970-2023 Download PDF Download as image (PNG)

High Contrast Mode

Exploration wells spudded on the Norwegian continental shelf, 1970-2023

In 2023, 15 new discoveries were made, 12 of them in the North Sea, two in the Norwegian Sea and one in the Barents Sea. The discoveries have a preliminary total estimate of 52 million standard cubic metres of recoverable oil equivalents (Sm3 o.e.). The largest discoveries in 2023 are 35/10-10 S and 25/7-11 S (Norma) in the North Sea. Several of the discoveries are located in areas where they can be developed via existing infrastructure. Here, even small discoveries can contribute to significant value creation.

Gross resource growth and number of wildcats (completed), 1990-2023

Updated: 20.02.2024

Source: Norwegian Offshore Directorate

Print illustration Download data Gross resource growth and number of wildcats (completed), 1990-2023 Download PDF Download as image (PNG)

High Contrast Mode

Gross resource growth and number of wildcats (completed), 1990-2023

439 wildcat wells have been completed on the Norwegian shelf between 2010 and 2023, resulting in 215 discoveries. These numbers show a success rate of about 50 per cent, which is high by international standards.

Exploration costs and players

Exploration costs include costes related seismic data acquisition of to map potential petroleum deposits under the seabed and related to drilling of wells for further investigations. The elements of exploration costs are illustrated in the figure below.

Several of the largest international companies have a central place on the Norwegian continental shelf. However, as areas have matured, new and more varied challenges have arisen. This has led to a change in the numbers and types of companies engaged in oil and gas activities on the Norwegian shelf. Generally low entry barriers to exploration on the Norwegian shelf encourage a diversity of companies and promote competition. The reimbursement scheme for exploration costs has been a contributing factor. High oil prices, exciting exploration areas, good exploration results and implemented measures by the authorities contributed to diversity, competition and exploration of the Norwegian continental shelf in the years 2002-2013. Since 2013, there has been a decline in the number of players, partly due to the fact that large international companies and European gas/power companies have sold out of the Norwegian continental shelf in recent years.

Overall exploration costs and number of companies, 2000-2023

Source: Norwegian Offshore Directorate

Print illustration Download data Overall exploration costs and number of companies, 2000-2023 Download PDF Download as image (PNG)

High Contrast Mode

Overall exploration costs and number of companies, 2000-2023

New exploration companies have been especially prominent in APA rounds (Awards in predefined areas), where blocks in mature areas on the shelf are announced. Exploration in frontier areas, on the other hand, is mainly carried out by the larger companies. The lesser-known geology in these areas increase the potential for discoveries, but can also present greater challenges in both the exploration, development and production phases.

Exploration costs are expenses related to seismic data acquisition to map potential petroleum deposits under the seabed and to drilling of exploration wells. In 2023, 33 exploration wells were completed at a total cost of about NOK 26 billion. In comparison, 33 exploration wells were completed in 2022, and exploration costs amounted to NOK 23 billion.

Licensing position for the Norwegian continental shelf

The total area of sea under Norwegian jurisdiction is almost 6 times the size of mainland Norway, Svalbard and Jan Mayen. About half the area consists of sedimentary rock that may contain petroleum.

The total area of sea under Norwegian jurisdiction is 2 279 965 km², which is almost 6 times the size of mainland Norway, Svalbard and Jan Mayen. About half the area of seabed consists of sedimentary rock that may contain petroleum. The extent of this area is indicated by the black line on the map.

The map gives an overview of the current status of the Norwegian continental shelf. The green areas have been opened for petroleum activity by the Storting (Norwegian parliament). The yellow areas have also been opened, but are subject to special arrangements as described in the white paper the white paper no. 20 (2019-2020). The areas outlined in red are covered by the system of awards in predefined areas (APA).

Licensing position for the Norwegian continental shelf

Download as image (PNG)

Source: Norwegian Offshore Directorate

Area status of the Norwegian continental shelf
Source: Norwegian Offshore Directorate

Awards in predefined areas

APA 2023

Announcement and applications

The Ministry of Energy announced 10 May 2023 the APA 2023. The predefined areas (APA acreage) have been expanded with a total of 92 blocks west in the Norwegian Sea and west in the Barents Sea. When the application deadline expired on 23 September 2023, a total of 25 companies had submitted applications for new exploration acreage on the Norwegian continental shelf. 

Offered awards

16 January 2024, 24 companies have been offered ownership interests in a total of 62 production licences in the APA 2023. Of the 62 production licences, 29 are in the North Sea, 25 in the Norwegian Sea and eight in the Barents Sea. 16 of the production licences are additional acreage to existing production licences. More detailed information can be found on the Norwegian Offshore Directorate's webpage.

Licence shares offered in APA 2023

Download as image (PNG)

Source: Norwegian Offshore Directorate

Awards in predefined areas 2023
Source: Norwegian Offshore Directorate

25th Licensing Round

Public consultation and announcement

In June 2020, the Ministry of Energy proposed announcing nine areas in the 25th licensing round, distributed over eight areas in the Barents Sea and one area in the Norwegian Sea. The proposal has been submitted for public consultation. The deadline for consultation comments was at 26 August 2020. A total of 30 consultation statements were received.

The 25th licensing round was announced on 19 November 2020. This round comprises a total of 136 blocks/parts of blocks, 125 in Barents Sea and 11 in Norwegian Sea. The deadline for applications was set for 23 February 2021 where seven companies have applied for new production licences.

Offered awards

On the 23th of June 2021 seven companies received offers of ownership interests in a total of four production licenses on the Norwegian Shelf in the 25th licensing round. Three of the licenses are in the Barents Sea and one license is offered in the Norwegian Sea.  More detailed information can be found on the Norwegian Offshore Directorate's webpage.

Previous licensing rounds

Information about previous licensing rounds is found at the Norwegian Offshore Directorate's webpage. See the article about Exploration policy for more information about the licensing system.

Seismic surveys

Seismic data provide a detailed picture of geological structures beneath the Earth’s surface. Acquiring and analysing seismic data is therefore the first step when rock formations are surveyed for possible petroleum deposits.

By acquiring and analysing seismic data, it is possible to build up an image of the geological structures under the Earth's surface. Once structures that may contain petroleum deposits have been identified, the next step is to drill an exploration well.

What is a seismic survey?

In a seismic survey, sound pulses are emitted into the rock formations below the seabed. The sound waves are reflected back to sensors that are either placed on the seabed or towed behind a seismic vessel.

Seismic data has to be processed before geologists can study the imaged conditions under the seabed.

There are several categories of seismic surveys:

  • In 2D surveys, the data are collected by a single sensor cable. This provides a relatively low resolution image of the underground, and is used for reconnaissance in new exploration areas.
  • In 3D surveys, seismic data are collected by several parallel sensor cables, providing a three-dimensional and more detailed image of the subsurface. This is used in the exploration/appraisal phase.
  • 4D surveys consist of repeated 3D surveys of the same area in order to detect any changes in a reservoir over time as a result of production or injection. These surveys are conducted in producing fields.

Seismic data acquisition by the authorities

The Norwegian Offshore Directorate is responsible for mapping before an area is opened for petroleum activities. The mapping includes the acquisition and analysis of seismic data.

The Norwegian authorities have been collecting seismic data in areas of the continental shelf that are not open for oil and gas activities since 1969. This is a task the Norwegian Offshore Directorate performs on behalf of the Norwegian state.

Seismic activity
Ramform Vanguard collecting seismic data (Photo: PGS)

Licences

All seismic surveys in connection with petroleum activities on the Norwegian continental shelf must be authorised by a production or exploration licence.

Production licences are awarded by the Ministry of Energy through the regular licensing rounds. A production licence applies to a specific area and grants exclusive rights to undertake oil and gas activities in the area.

Exploration licences are awarded by the Norwegian Offshore Directorate for areas of the Norwegian continental shelf that are open for petroleum activities but where no production licence has been awarded. They do not grant exclusive rights to petroleum activities in the specified area.

Seismisk profil / Seismic profile
Example of broadband multi-sensor 3D seismic covering two discoveries in the Aasta Hansteen area (data courtesy of PGS).

Marketable seismic data

Marketable seismic data is acquired for the purpose of submitting the data for sale to a third party, ref. "multiclient seismic". These surveys are carried out by seismic companies that have been awarded exploration licences, but normally do not themselves apply for production licences.

Acquired seismic data are reported to the Norwegian Offshore Directorate under section 20 of the Resource Management Regulations. The data are managed in accordance with section 85 of the Petroleum Regulations on administrative procedures and the duty of secrecy/release of data.

Notification requirements

To inform other users of the sea, all seismic surveys must be reported to the Norwegian Offshore Directorate no later than five weeks prior to commencement. Notification is submitted electronically via the Norwegian Offshore Directorate’s website. When the notification has been registered, copies are automatically sent to the Directorate of Fisheries, the Institute of Marine Research and the Norwegian Joint Headquarters.

According to current practice, these agencies provide expert advice on for example spawning, fishing and military activities in the specific area. This information is then transmitted to the licensee by the Norwegian Offshore Directorate.

More information on planned, ongoing and completed seismic surveys is also published on the Norwegian Offshore Directorate’s website.

Fisheries experts

To contribute to a smooth coexistence between fisheries and seismic data acquisition, the petroleum regulations require any vessel engaged in seismic surveying to have a fisheries expert on board. The fisheries expert must have completed an approved course and be certified by the Norwegian Offshore Directorate.

Other geophysical data

In recent years, a significant amount of other geophysical data has been acquired. An example is electromagnetic data, so-called CSEM data (Controlled Source Electro-Magnetic).

Developments and operations

In the 50 years since Norwegian petroleum activities began, over 50 per cent of the estimated total recoverable resources on the continental shelf have been produced and sold from a total of 123 fields. 92 fields were in production at year-end 2023, and with large remaining resources, it is expected that the level of activity on the Norwegian shelf will continue to be high for the next 50 years as well.
Goliat float-on

Recent activity

The activity level on the Norwegian shelf has been high in recent years. Several new fields have been approved to be developed, and several ongoing field development projects are close to completion or have recently come on stream. Simultaneously, large investments have been made on producing fields to improve recovery. In 2023, a total of 233 million Sm³ o.e. has been produced. At year-end, 92 fields were in production.

Since production started on the Norwegian continental shelf (NCS) in 1971, oil and gas have been produced from a total of 123 fields. At the end of 2023, 92 fields were in production: 67 in the North Sea, 23 in the Norwegian Sea and two in the Barents Sea. Overall production from these fields was 233 million standard cubic metres of oil equivalents (Sm3 o.e.) in 2023, about 12 per cent lower than in the peak year of 2004, but at the same level as in 2022.

Production levels

For the next few years, total production on the NCS is expected to be relatively stable, as the decline in production from aging fields is anticipated to be at the same level as the production from new fields that come on stream. In the long term, the number and size of new discoveries will be of crucial importance to the production level.

Gas currently accounts for around half of the total production, and this proportion is expected to continue for several years. By comparison, gas accounted for about 30 per cent of the Norwegian petroleum production in the record year of 2004.

Historical and expected production in Norway, 1970-2028

Updated: 11.01.2024

Source: Norwegian Offshore Directorate

Print illustration Download data Historical and expected production in Norway, 1970-2028 Download PDF Download as image (PNG)

High Contrast Mode

Historical and expected production in Norway, 1970-2028
In the long term, the number and size of new discoveries will be of crucial importance to the production level

Several of the large, aging fields still have substantial remaining reserves. The activity level on producing fields will remain high in the years ahead. These fields will account for the bulk of production in the coming years. Moreover, the resource base for existing facilities increases when small, neighbouring discoveries are tied-in to the existing infrastructure.

It is possible to increase recovery from many of these fields beyond existing plans. The licensees on the NCS are continuously working on new projects to increase recovery from existing fields. It is important for the licensees to find profitable ways of improving recovery and making operations more efficient on existing fields. In addition, existing and new commercially viable discoveries need to be tied-in to existing infrastructure to utilise the production and transport capacity in mature areas in the years ahead.

See resource management in mature areas for more detailed information.

Production history and forecast distributed per resource category, 2019-2033

Updated: 11.01.2024

Source: Norwegian Offshore Directorate (Gas is normalised at 40 MJ)

Print illustration Download data Production history and forecast distributed per resource category, 2019-2033 Download PDF Download as image (PNG)

High Contrast Mode

Production history and forecast distributed per resource category, 2019-2033

A large number of fields are in production on the Norwegian continental shelf, and several new fields will come on stream during the next few years. It is therefore expected that the production will remain relatively high in the next decade.

See article about production forecasts for more detailed information.

Photo: Ministry of Energy

Field developments and development projects

Four new fields came into production in 2023: Fenja and Bauge in the Norwegian Sea, and Tommeliten A and Breidablikk in the North Sea. In addition, the development projects Frosk (as part of the Bøyla field), Kobra East and Gekko (as part of Alvheim field) and Blåbjørn (as part of Åsgard field) were completed. Furthermore, Hywind Tampen, Norway's first floating offshore wind farm, was completed and put into full operation in 2023. It is the first wind farm to supply oil and gas installations with electricity and is connected to the Gullfaks and Snorre fields.

At year-end, about 80 discoveries were, or could be, considered for development. Most of them are small and will be developed as satellites to existing fields. Stand-alone developments are planned for the largest discoveries, but several smaller discoveries could build new infrastructure through collaborated development solutions.

In 2023, the authorities approved a record-breaking number of new development projects. The largest of these projects are Yggdrasil (Munin, Hugin and Fulla) and Valhall/Fenris. In addition, plans were approved for the development and operation of Halten Øst, Tyrving, Irpa, Verdande, Symra, Ørn, Idun Nord, Alve Nord and Berling. Amended plans for the development and operation of Snøhvit Future, Maria phase 2, Draugen and Njord were also approved.

The table below shows the estimated reserves in fields under development. Please note that the table is continuously updated.

Reserves in fields under development

All volumes in million Sm³ o.e.

Source: Norwegian Offshore Directorate

Print table Download data Reserves in fields under development

Reserves in fields under development – All volumes in million Sm³ o.e.

At the year-end of 2023, 27 development projects were ongoing on the NCS. Of these, 15 are new field developments, while 12 are amendments to existing fields (related to increased recovery, changes to power supply or development of additional resources to existing fields). The interactive map below shows ongoing development projects. Investments are estimates from the PDO in 2022 NOK. Note that the map is not updated continuously and the geographical location on this map is inaccurate.

interactive-figure Created with Sketch.
Use two fingers to drag
Johan Sverdrup field

Johan Sverdrup is the third largest oil and gas field in the North Sea, situated 140 kilometres west of Stavanger. When the field was proven in 2010, it was the largest discovery made on the Norwegian shelf in 30 years.

The field was developed in two phases. Development of the first phase was approved by the authorities in 2015. Production from the first phase started in October 2019, nine years after the field was proven. The development solution for the first phase of Johan Sverdrup is a field centre with four facilities: living quarters and process, drilling and riser facilities. The development plan for the second phase was approved in May 2019 and the production started in December 2022. The development solution for the second phase includes a process facility and five subsea templates in addition to modifications to the riser facility.

Johan Sverdrup is operated with power from shore, together with other fields in the Utsira High area. Power from shore helps to ensure oil production takes place with low emissions to air. According to the operator, one barrel of oil produced on Johan Sverdrup during the field’s first year released 0.17 kg CO2 – which means that CO2 emissions are nearly 100 times lower than the global average.

The Johan Sverdrup field accounts for about 40 per cent of the Norwegian oil production

Investments

Investments in the petroleum sector in 2023 were approximately NOK 160 billion. Several ongoing projects, both related to new field developments and to fields in operation, will contribute to an increasing activity level in 2024.

See article about investments for more detailed information.

Johan Sverdrup field
Photo: Lizette Bertelsen/Jonny Engelsvoll / Equinor

Outlook for activity on the shelf

There will be a high activity level in the industry the coming years. The petroleum industry will continue to be Norway’s largest and most important industry for the foreseeable future. New projects on fields in operation, as well as infill drilling, will result in a relatively high level of activity. In addition to the activities on existing fields, there are several new fields under development and other new projects that are expected to be decided for development.

Significant exploration activity is expected in the next few years. At the same time, many new production wells will continue to be drilled. Commercially viable discoveries are required to ensure a stable activity level in the long term, and that requires maintaining exploration activity over time.

Effective resource management in mature areas

Improving the recovery rate on fields in production can further add to value creation on the Norwegian shelf. Declining production from a field also releases infrastructure capacity, which can be used by tying in new resources to the same infrastructure. In some cases, new smaller deposits can only be profitably developed and produced by using existing infrastructure.

To ensure sound long-term management of petroleum resources and consideration of other important public interests, the authorities have established a clear and predictable framework for development and operation. This includes requirements for operators to seek long-term, integrated and effective solutions at all stages from field development to decommissioning.

Major investments are being made to improve recovery from fields in production on the Norwegian shelf. This, combined with favourable geological conditions, means that the recovery rate on the Norwegian shelf is high compared with rates in other petroleum provinces. Moreover, new satellite discoveries are being tied in to infrastructure on existing fields, ensuring that the infrastructure is used efficiently and that the lifetime of the fields can be extended.

When operations have been closed down, the area must be cleared and the installations disposed of (made safe in place or removed).

Improved recovery

The average oil recovery rate for oil fields on the Norwegian shelf is currently about 47 %, and the aim is to increase this further. However, recovery rates differ greatly from field to field, partly because reservoir conditions vary and different technical solutions are applied.

Significant oil resources will not be recovered using current technology and plans. About half of these resources require advanced methods, known as "Enhanced Oil Recovery" (EOR), in order to be produced. It is important that new EOR methods are tested, qualified and implemented on the Norwegian shelf within a reasonable period, to increase recovery and avoid loss of substantial oil volumes.

There is a huge potential for increased recovery from several fields on the Norwegian shelf. In cooperation with Imperial College in London, the Norwegian Offshore Directorate has studied the potential for improved recovery using EOR methods on the 46 largest oil fields and discoveries on the shelf. The conclusion of the analysis is that there is a considerable technical EOR potential of about 700 MSm3 of oil. This corresponds to almost as much oil as two Johan Sverdrup fields. A scaled EOR potential has also been computed by taking operational, financial and environmental factors into account when implementing EOR methods in fields. The scaled EOR potential, using given criteria, is calculated at approximately 350 MSm3 of oil.

For more details about the EOR screening study, see "The challenging barrels" in Norwegian Offshore Directorate's Resource Report 2019.

Distribution of oil reserves and resources for the largest oil fields as of 31 December 2023

Source: Norwegian Offshore Directorate

Print illustration Download data Distribution of oil reserves and resources for the largest oil fields as of 31 December 2023 Download PDF Download as image (PNG)

High Contrast Mode

Distribution of oil reserves and resources for the largest oil fields as of 31 December 2023

The process of ensuring the highest possible recovery rate from a field starts when development is being planned and the facilities are being designed. Most oil fields on the Norwegian shelf incorporate pressure support in the form of water and/or gas injection from the time they come on stream. Constant improvements in technology for and knowledge about reservoir monitoring are making it possible to design better recovery strategies for the fields.

Systematic data acquisition and use of production and reservoir data increase understanding of reservoir properties throughout the production phase. An improved understanding of where oil and gas are located and their flow paths makes it possible to place wells more effectively. As new drilling targets are identified in this way, additional wells need to be drilled.

The steady improvement in understanding of reservoir properties throughout the production phase tends to result in considerable differences between the production forecast used in the original plan for development and operation (PDO) for a field and the volumes actually produced. The figure below shows the differences for selected fields on the Norwegian shelf.

Extended lifetime - production trends for Ekofisk, Varg, Oseberg and Ula

Download as image (PNG)

Source: Norwegian Offshore Directorate

Production trends for Ekofisk, Varg, Oseberg and Ula
ource: Norwegian Offshore Directorate

The amount of oil that can be produced from a field is a function of factors including reservoir conditions, the development solution chosen, the production strategy and the available technology. It may be possible to extract oil not included in current production plans by using improved recovery methods. This oil can be divided into two categories – mobile and immobile.

Mobile oil can in principle be recovered using conventional production wells and techniques, by drilling additional wells and increasing the duration of water and/or gas injection.

Immobile oil adheres to the pore walls in the reservoir, and cannot be forced out of the pores and produced by water or gas injection. More advanced methods, known as enhanced recovery techniques, are needed to mobilise a proportion of the immobile oil.

Third-party access and development of discoveries near existing infrastructure

According the the National Accounts, more than NOK 4 000 billion at the current monetary value has been invested on the Norwegian continental shelf. The infrastructure financed by these investments is used to produce and transport oil and gas and can also be used to produce further resources more cost effectively.

Exploration and development of resources close to existing infrastructure can result in substantial value creation for the Norwegian society. Declining production from a field releases infrastructure capacity, which can be used efficiently by tying in new resources to the same infrastructure.

In some cases, new smaller and surrounding deposits can only be profitably developed and produced by using existing infrastructure. These are sometimes known as time-critical resources, because they need to be produced before the existing infrastructure is phased out.

Risers at Kvitebjørn
Risers on the Kvitebjørn platform - Photo: Harald Pettersen, Equinor (Statoil)

In order to promote the effective use of existing infrastructure, including platforms and pipelines, the Ministry of Energy adopted regulations relating to the use of facilities by others (the Third-party Access Regulations), which entered into force in 2006.

The objective of the regulations is to promote the efficient use of facilities and thereby provide incentives for licensees to conduct exploration and production activities close to existing infrastructure. To this end, they set out a framework for negotiations and for tariffs and conditions in agreements on the use of facilities by others. The regulations do not alter the principle that negotiating good solutions is the task of the commercial actors themselves.

Third-party access (TPA)

Regulations of 20 December 2005 no. 1625 aim to ensure efficient use of the infrastructure and thereby give licensees good incentives to conduct exploration and production activities close to existing infrastructure.

The regulations provide a framework for the negotiation process between owner and user of the facilities, and for the formulation of tariffs and terms in agreements on others' use of facilities.

Disagreements that arise under the regulations can be brought to the Ministry of Energy for a decision, cf. section 13 of the regulations. The Ministry's decisions are being published on the Ministry's website (in Norwegian).

Cessation and decommissioning

Currently, about half of the expected recoverable resources on the Norwegian continental shelf have been produced. At the same time, some of the many facilities on the shelf are approaching the end of their expected lifetime. In the coming years, several of these facilities will be shut down and decommissioned in a responsible manner.

On the Norwegian shelf, there are currently 12 concrete facilities (Heidrun A and Troll B are floating), 65 fixed steel facilities and 21 steel floating facilities in operation. In addition, there are nearly 500 subsea installations. The concrete facilities account for about 70 per cent of the total weight of facilities on the shelf.

Field developments vary greatly with regard to size, complexity and number of facilities. Major fields can have development and operation in multiple phases, where some facilities are phased out while others are still operational. Larger and more comprehensive disposal projects must be carried out over several years. The Frigg field is, so far, the largest field on the shelf where decommissioning of the facilities has been completed. Production ceased in 2004, and the offshore disposal work started in 2005. The extensive disposal work on the field was completed in 2010.

The disposal process begins once a facility is no longer being used, and requires that the facility must be removed and the area cleared. The licensees are required to provide a detailed description of all phases of this process in a decommissioning plan. The plan must be submitted to the Ministry of Energy within two to five years prior to a licence expiring or being relinquished, or when use of a facility ceases.

What does a decommissioning plan consist of?

The decommissioning plan consists of two main parts, a disposal part and an impact assessment part. The disposal part describes the technical and financial aspects of the cessation project. The impact assessment part provides an overview of expected consequences of the disposal, e.g., for the environment and other users of the sea. Both the proposed impact assessment programme and the actual impact assessment report must be submitted for public consultation.

Key principles for processing a decommissioning plan are that all financially profitable and recoverable oil and gas resources must have been produced, that the decommissioning project is cost-effective and that the project can be carried out within an acceptable framework regarding health, safety and environment (HSE) and other users of the sea. At present, the authorities have processed several decommissioning plans both for entire fields and for some facilities on fields in operation. Based on decommissioning plans, disposal decisions are made where final deadlines are set for the completion of removal projects.

A number of fields are now in a mature phase and have produced a large proportion of their original reserves. At the same time, the fields that are expected to be shut down in the near future have little impact on the total production on the shelf. However, it is difficult to estimate exactly when producing fields will shut down. Usually, facilities stay on fields longer than planned for in the development stage. On many fields, new tie-ins (satellite fields) and improved recovery initiatives have extended field lifetimes beyond what was estimated in the plan for development and operation (PDO). The commercial life of facilities which are no longer producing from their own deposits may be extended if they can function as host installations for other developments in the area. It is therefore important to explore all opportunities for utilising such facilities before a final disposal decision.

Extended lifetime for selected fields

Download as image (PNG)

Lifetime for some fields
Source: Norwegian Offshore Directorate

Current regulations

Cessation of the petroleum activities and disposal of facilities are regulated by the Petroleum Act and Petroleum Regulations. Norway acts also in accordance with international regulations and agreements, such as the Oslo-Paris Convention (OSPAR), which stipulates that petroleum facilities can be abandoned after shutdown only in highly extraordinary scenarios.

Section 5-3 of the Petroleum Act stipulates that the Ministry of Energy makes disposal decisions. Article 60 of the United Nations Convention on the Law of the Sea (UNCLOS) stipulates that facilities shall, as a rule, be removed, and that both removal and potential abandonment shall take place in accordance with internationally accepted standards. In accordance with this and the OSPAR Convention, the authorities decide on removal of subsea facilities, floating steel facilities and the topsides of concrete installations. However, if disposal of concrete facilities and the jacket on large, fixed steel facilities is subject to OSPAR consultation, it is assumed that countries considering offshore disposal must consult the other countries that are parties to the OSPAR Convention before national authorities take disposal measures.

The Ministry has so far processed more than 20 disposal plans. Two permits have been granted to leave parts of an offshore installation under the exemption provision of OSPAR decision 98/3. This applies to the concrete substructure of the Ekofisk tank and concrete substructure on the Frigg field. Such permissions was granted following consultation in accordance with the OSPAR Convention.

Facilities must be removed in their entirety; only in extremely limited cases they can be abandoned on the field after ended use

Pipelines are not covered by the OSPAR Convention. The choice of disposal options is determined in each individual case based on a comprehensive evaluation, where costs are assessed in relation to the consequences for safety, environment, fisheries and other users of the sea.

See this information from Norwegian Offshore Directorate for more details (in Norwegian).

Landing and scrapping/recycling

Facilities that are not re-used or abandoned on the field must be transported to land and handled at a permitted facility for scrapping and recycling or disposal. Most of the waste from the petroleum activities (98 per cent) is recyclable steel. However, there will also be waste that requires special handling. The facilities that have a permit under the Pollution Control Act to demolish offshore installations are to be find on Norwegian Environment Agency’s website.

Since the scrapping facilities in Norway are located on deep fjords and have deep-water quays, other countries on the North Sea are likely to consider utilising these facilities in the future.

AF Miljøbase Vats – Installations landed from the Ekofisk area

Download as image (PNG)

Photo: Ellen Marie Hagevik, Medvind24

AF Environmental Base Vats
Photo: Ellen Marie Hagevik, Medvind24

Disposal costs

The costs related to shutdown and disposal of facilities are relatively small compared to the costs related to exploration, development and operations and the revenue from the field. Costs related to decommissioning are uncertain and vary from field to field. The largest cost elements in disposal projects are related to permanent plugging of wells and removal of the offshore facilities.

Cooperation between licensees, the service and supply industry, the authorities and affected interest groups is crucial for cost-effective disposal activities in the future, and in turn contributes to reducing costs.

Activity per sea area

Petroleum activities on the Norwegian shelf started in the North Sea and have gradually expanded northwards. Since 1980, there has also been activity in the Norwegian Sea and the Barents Sea.

The Norwegian continental shelf covers an area of more than two million square kilometres (2 039 951 km2). This is almost six times the land area of mainland Norway, Svalbard and Jan Mayen.

The North Sea is still the powerhouse of the Norwegian petroleum industry, with 67 fields in production. In addition, there are 23 fields in production in the Norwegian Sea and two (Snøhvit and Goliat) in the Barents Sea.

Each of these areas is divided into quadrants corresponding to a degree of longitude and latitude. Each quadrant is further divided into 12 blocks. The quadrants in the North Sea are numbered from 1 to 36, while those in the Norwegian Sea and Barents Sea are named by the degree of longitude and latitude.

North Sea

The Norwegian part av the North Sea covers an area of 142 000 km2. This is the most thoroughly explored part of the Norwegian shelf, and the area that has most discovered and produced oil and gas. There are now 67 fields in production in the North Sea.

Fields and discoveries in the North Sea

Download as image (PNG)

Source: Norwegian Offshore Directorate

Felt og funn i Nordsjøen
Kilde/Source: Sokkeldirektoratet/Norwegian Offshore Directorate

Southern North Sea

Norway’s oil era started in earnest in the southern North Sea, with the discovery of Ekofisk in 1969. Ekofisk has been producing for more than 50 years, and according to current plans, production will continue for another 30 years. There are still considerable remaining resources in this area. The Ekofisk complex is a hub for petroleum activities in this area, and many fields are tied in to the Ekofisk infrastructure for onward transport.

Oil and gas from fields in this area are transported by ship or pipeline to onshore facilities in the UK and continental Europe.

Fields and discoveries in the southern North Sea

Download as image (PNG)

Source: Norwegian Offshore Directorate

Felt og funn i den sørlige delen av Nordsjøen
Kilde/Source: Sokkeldirektoratet/Norwegian Offshore Directorate

Central North Sea

The first oil discovery on the Norwegian continental shelf was made in this area. The Balder field was proven as early as 1967, but not developed until 30 years later.

The first development in the area was the Frigg gas field, which came on stream in 1977 and produced for nearly 30 years, until it was shut down in 2004. Several fields in this area have recently started production or are under development. The Johan Sverdrup field is the fifth largest oil discovery ever made on the Norwegian shelf. The field is developed in several stages. Production from the second stage started end of 2022.

The Sleipner facilities are also an important hub in the gas transport system on the Norwegian shelf. Gas is transported by pipeline to onshore facilities. The different pipeline systems are linked to onshore facilities in Norway, the UK and continental Europe. Most of the oil from this part of the North Sea is transported by tanker.

Fields and discoveries in the central North Sea

Download as image (PNG)

Source: Norwegian Offshore Directorate

Felt og funn i den midtre delen av Nordsjøen
Kilde/Source: Sokkeldirektoratet/Norwegian Offshore Directorate

Northern North Sea

Large fields such as Statfjord, Gullfaks and Snorre in the Tampen area, as well as the Oseberg and Troll fields, make the northern part of the North Sea one of the most important areas on the Norwegian continental shelf. Oil and gas has been produced from this area for more than 30 years, and production is expected to continue for at least another 30 years. For several of the fields that have been producing for a long time in this part of the North Sea, such as Snorre, the lifetime has been extended by the installation of new facilities and measures for increased recovery. Statfjord also has shown to produce better and longer than expected.

The Troll field is very important for the gas supply from the Norwegian shelf, and the field will play a leading role in Norwegian gas export for decades to come. In addition, Troll is a significant oil field.

Oil from this part of the Norwegian shelf is mostly transported by tanker; the rest, like the gas, is delivered by pipelines to onshore facilities in Norway or abroad.

Fields and discoveries in the northern North Sea

Download as image (PNG)

Source: Norwegian Offshore Directorate

Felt og funn i den nordlige delen av Nordsjøen
Kilde/Source: Sokkeldirektoratet/Norwegian Offshore Directorate

Norwegian Sea

The Norwegian Sea is twice as large as the North Sea, covering an area of 289 000 km2. This petroleum province has large gas reserves, and is less mature and less thoroughly explored than the North Sea. The only exception is the Halten Bank, where production of oil and gas started over 20 years ago.

Draugen was the first field to start producing in this area, in 1993. There are now 23 fields in production in the Norwegian Sea.

With the Aasta Hansteen field and the Polarled pipeline, a new gas region has been opened on the Norwegian continental shelf. The Norwegian gas transport system now extends to the north of the Arctic Circle.

Gas from the Norwegian Sea is largely transported by pipeline to various onshore facilities in Norway and further to the UK and continental Europe. Oil is transported by tanker (buoy-loaded on the fields).

Fields and discoveries in the Norwegian Sea

Download as image (PNG)

Source: Norwegian Offshore Directorate

Felt og funn i Norskehavet
Kilde/Source: Sokkeldirektoratet/Norwegian Offshore Directorate

Barents Sea

The Norwegian part of the Barents Sea covers an area of 313 000 km2, and is the largest sea area on the Norwegian continental shelf. The Barents Sea is also the sea area in Norway with the largest potential for oil and gas. Only the area south of 74° 30’ N is open for petroleum activities.

The only fields in production in the Barents Sea are Snøhvit and Goliat, which came on stream in 2007 and 2016, respectively. The Johan Castberg field is under development. Gas from Snøhvit is transported by pipeline to the Melkøya onshore facility, where it is processed and cooled down to produce liquefied natural gas (LNG), which is delivered to the markets on special LNG vessels. Produced oil and gas from Goliat are transported onto a Floating Production Storage & Offloading (FPSO) unit, where the oil is processed, stabilised and stored for further export in tankers. The gas from Goliat is reinjected into the reservoir.

Most of the Barents Sea is considered to be a frontier petroleum province, even though there have been exploration activities here for more than 30 years, and the first discovery was made in the early 1980s. It is estimated that approximately half of the undiscovered resources on the Norwegian continental shelf are in the Barents Sea.


Fields and discoveries in the Barents Sea

Download as image (PNG)

Source: Norwegian Offshore Directorate

Felt og funn i Barentshavet
Kilde/Source: Sokkeldirektoratet/Norwegian Offshore Directorate

The service and supply industry

The service and supply industry is Norway’s second-largest industry in terms of turnover, only surpassed by the sale of oil and gas, and consists of around 2000 companies. The Norwegian-based service and supply industry had a total turnover of NOK 374 billion in 2020, of which about 30 % in international markets. Throughout more than 50 years of offshore petroleum activities, the industry has developed cutting-edge technologies and leading expertise, making it internationally competitive.

Development and employment

Norway’s basis as a sophisticated industrial and shipping nation is one of the factors explaining how Norway managed to develop a world-leading, technologically advanced supply industry. Other factors include the need to handle challenging weather conditions in the North Sea, strict national legislation and HSE requirements, and high standards required by the operators. In many ways, the Norwegian continental shelf has functioned as a laboratory where companies have had to find new solutions and overcome technological challenges to be able to extract the petroleum resources.

The Norwegian continental shelf is one of the world’s largest offshore markets, providing a large domestic market for suppliers and a source of employment in all of Norway's counties.

According to a study by Kunnskapsparken Bodø with annual estimates of the petroleum-industry’s potential for value creation and employment in the northernmost counties in Norway (Nordland, Troms and Finnmark), 139 companies were suppliers of the petroleum industry in 2022, representative of 2154 man-years. Hammerfest had the most man-years with 1314 employed. See the article on employment for more information.


For many years, the petroleum-based service- and supply industry have been in transition. Both as a result of challenges like the oil price decline in 2014 and the Covid-19 pandemic, and the increased focus on renewable energy and low-carbon solutions. The operators and the service and supply industry have managed to reduce costs and increase efficiency, resulting in profitable projects even at low oil prices. Even though this has been a demanding process, it was also necessary to stay competitive in the long run. As a demonstration of its adaptability and competitiveness, Norwegian suppliers have won several big contracts both in domestic and international markets

The petroleum-based

Kværner Yard at Stord

Download as image (PNG)

Photo: Kværner.

Kvaerner Stord
Foto/Photo: Kvaerner.

A diverse industry

The Norwegian service and supply industry consists of roughly 2000 companies providing goods and services in all stages of the value chain.

For instance, in the discovery-phase there are companies providing seismic surveys, data processing, geological- and geophysical services, as well as drilling- and well-services. When a discovery is made, there will be demand for engineering services, platform solutions that needs to be developed at a yard and various types of equipment that has to be produced and installed.

Furthermore, production equipment needs to be placed and installed at the seabed, for then to be connected to the platform. In the operational phase, there will be demand for shipping services, maintenance- and other services. Since the production phase may last for many decades, it could also be relevant with larger upgrades, like new processing equipment and more wells. When it is no longer profitable to keep the field operating, the infrastructure must be disposed of.

Direct and indirect petroleum-related activity

Download as image (PNG)

The illustrations below shows the relationship between oil companies or operators (dark blue) and the different service and supply segments (light blue). The industry also consists of other services (orange), however, petroleum induced activity in these segments are not considered a part of the service and supply industry. (Source: International Research Institute of Stavanger (IRIS))

Direct and indirect petroleum related activity
Source: : International Research Institute of Stavanger (IRIS)

The petroleum-based services- and supply industry is located throughout Norway. The Stavanger-region employs the most and offers a wide range of services and goods. In other parts of the country, companies operating in the same market segment are clustered together based on their regional expertise.

In and around Oslo are well-established engineering expertise and a cluster of seismic companies. Trondheim has a strong position in education, research and development, while the Bergen region has become a hub for platform maintenance and subsea equipment. In Buskerud, especially in Kongsberg, is a strong cluster focusing on subsea technology, automation and dynamic positioning equipment. Southern Norway is home to world-leading companies specialising in drilling technology. The North-West of Norway has maritime companies that together make up a complete shipbuilding and outfitting cluster.

Technologies originally developed specifically for the petroleum sector are also applied in a range of other sectors, along with the service and supply industry's experience and expertise. One example is offshore wind – and floating offshore wind in particular. Another area utilising design principles and technology from the petroleum sector is open ocean aquaculture. Other examples include carbon capture and storage, water purification, sensors used in satellites, and medical research.

The Norwegian petroleum industry covers the entire supply chain

Download as image (PNG)

Sketch of a field during development and operation (Source: Ministry of Energy)

The diversity of the Norwegian service and supply industry
Source: Ministry of Energy
The Norwegian supply industry is world-leading in subsea technology

Rapid developments in subsea technology are making it possible to extract oil and gas at increasing depths and distances from land. Subsea solutions will play a vital role in the development of new discoveries in the Barents Sea.

Exciting new developments include a breakthrough in subsea compression technology in Norway. Equinor (former Statoil) has two seabed compression projects on the Åsgard and Gullfaks fields on the Norwegian shelf. The aim is to maintain the level of production as the pressure in the reservoirs drops. Equinor envisages the installation of this type of technology on more fields as a cost-effective way of increasing the recovery rate and prolonging field lifetime.

The Åsgard subsea compressor, delivered by Aker Solutions, is the first subsea compression system in the world. It will boost recovery from the Mikkel and Midgard reservoirs by 306 million barrels of oil equivalents. In developing the system, Aker Solutions drew on experience it gained during a pilot project on subsea compression on Ormen Lange.

The subsea wet gas compressor for Gullfaks is another example of cutting-edge technology, and was developed by OneSubsea in cooperation with Equinor. This is the first system of its kind in the world, and is expected to increase the recovery rate for Gullfaks Sør from 62 % to 74 %. This means that production will rise by 22 million barrels of oil equivalents. The compressor station was built and tested entirely by suppliers and subcontractors in Western Norway.

Subsea gasskompresjonsanlegget til Åsgard

Picture of the Åsgard subsea compressor.(Illustration: Equinor)

An industry with international scope

The Norwegian service and supply industry is active in offshore markets all over the world. In 2020, the industry had a total turnover of NOK 374 billion, of which NOK 109 billion or about 30 % came from international markets.

Subsea equipment and installation was the segment with the largest turnover internationally in 2020. This was followed jointly by the segment for Operations- and professional services, and topside- and processing equipment. The three largest markets measured in turnover in 2020 was the United Kingdom, USA and Brazil. The shipping nations Singapore and South Korea constitute important markets within well-packages and other equipment for platform and drilling.

In 2020, the industry had a total turnover of NOK 374 billion, of which NOK 109 billion or 30% came from international markets

The Norwegian petroleum-based supply- and services industry have for many years been transitioning as a result of changes in the market, first following the oil price decline in 2014 and now with the Covid-19 pandemic. Increased focus on climate and significant growth within renewable energy and low-carbon solutions are an important additional driver for the transition where particularly offshore wind has similar characteristics like the petroleum-based activity offshore. The activity associated with oil and gas will continue to be the foundation for the supply- and services industry for many years to come.

International revenues in the Norwegian service and supply industry 2020, 10 largest countries

Updated: 16.03.2022

Source: Rystad Energy

Print illustration Download data International revenues in the Norwegian service and supply industry 2020, 10 largest countries Download PDF Download as image (PNG)

High Contrast Mode

International revenues in the Norwegian service and supply industry 2020, 10 largest countries

Export and internationalisation

Exports of services and goods from the Norwegian-based energy industry is important for employment and value creation in Norway. Norwegian authorities have therefore contributed to more export-oriented policies that promotes Norwegian-based energy industries abroad. For instance is NORWEP, Norwegian Energy Partners, the Government’s most important policy organisation in this regard.

NORWEP - Norwegian authorities most important organisation for internationalisation of the Norwegian-based energy industries

The foundation Norwegian Energy Partners (NORWEP) is a successful public-private partnership and was established by Norwegian authorities by the Norwegian Ministry of Foreign Affairs, Norwegian Ministry of Trade and Fisheries, and the Norwegian Ministry of Energy, in addition to The Norwegian Shipowners Association, Offshore Norge, Energy Norway, The Federation of Norwegian Industries, LO Norway, Equinor and Statkraft. NORWEP provides councelling in 26 important markets, in addition they offer a variety of services that are important for Norwegian-based companies with internaitonal operations. NORWEP has mandate to contribute to increaesd value creation and employment in Norway through the promotion of exports from all parts of the Norwegian-based energy industry. Read more here: www.norwep.com

Diversity and competition

The composition of companies on the Norwegian continental shelf has developed as the shelf has matured, along with changed framework and market conditions. It is important that the player landscape reflects the challenges and opportunities at any given time in order to ensure effective exploration, development of discoveries and resource utilisation on operating fields.

An overarching goal of the petroleum policy is to facilitate efficient and profitable exploitation of the oil and gas resources in a long-term perspective. Strong competition and a diversity of players in all parts of the value chain are important for good resource utilisation and to ensure sufficient interest in the opportunities that are found on the shelf.

Production licences are normally awarded to a group of companies, led by an operator. Through the cooperation in the production licence, the various companies will check and challenge the operator’s assessments so that the best possible decisions are made, while at the same time allowing less experienced companies to build more expertise.

Since 2000, there has been a considerable increase in the number and diversity of companies operating on the Norwegian shelf. Before this, a small number of large Norwegian and international companies dominated. As parts of the continental shelf have matured and different challenges have arisen, the Norwegian authorities have considered it important to make adjustments to ensure effective exploration, development of discoveries and production on fields that are on stream.

Since 2000, there has been a considerable increase in the number and diversity of companies operating on the Norwegian shelf

Three adjustments in the framework conditions have been particularly important in stimulating competition and increasing the diversity of companies on the shelf:

  1. The prequalification system was established to give companies an opportunity to secure an evaluation of their suitability for participation on the Norwegian continental shelf before they devote resources to assessing concrete business opportunities. There has been very significant interest in prequalification since the system was introduced, and there continues to be a steady stream of companies who want to secure such an advance assessment.
  2. The APA scheme, together with adjustments in how work programmes are designed, give the companies steady access to exploration acreage and ensures continuous exploration activity. In this way, the system also facilitates efficient use of resources in the oil companies and ensures that acreage previously relinquished by other companies becomes available to companies with new ideas. This means that previously awarded acreage will also be subject to new assessments.
  3. The exploration reimbursement scheme was introduced to ensure equal tax treatment of exploration costs for companies both inside and outside tax position. This will thus reduce entry barriers for new players and facilitate profitable exploration. Through the exploration reimbursement scheme, the companies can choose whether they want to receive a refund of the tax value (78 per cent) of the exploration costs in subsequent years, or whether they prefer to deduct the exploration costs from the tax basis. Established companies in tax position can deduct exploration costs on a continuous basis and thus reduce their tax payments. Companies that are not in tax position can either offset the tax value of the exploration costs or alternatively carry the loss forward with interest compensation (and possibly receive a refund of the tax value of the loss in the event they cease activity on the Norwegian shelf). For small companies that are not yet in tax position, the reimbursement scheme provides lower tied-up capital, and thus an improved cash flow.
Ekofisk South
Picture from the ConocoPhillips operated Ekofisk field (Photo: Ministry of Energy)

The companies that have entered the Norwegian continental shelf since 2006 have contributed to a number of discoveries. Several of these companies have also made the transition from exploration activity into the development and operations phase. Larger resources, and a different type of resources, are required for companies that are developing fields as compared with companies that are only active within exploration activity.

At year-end 2023, there were 27 exploration and production companies active on the Norwegian shelf, 20 of which were operators. This is a smaller number compared with a few years ago, and is the result of factors including consolidation among the companies. While some companies have opted to leave the shelf, in whole or in part, others have reinforced their activity.

Number of companies on the Norwegian continental shelf 2000-2023, by size

Source: Norwegian Offshore Directorate

Print illustration Download data Number of companies on the Norwegian continental shelf 2000-2023, by size Download PDF Download as image (PNG)

High Contrast Mode

Number of companies on the Norwegian continental shelf 2000-2023, by size

No other players can match Equinor (former Statoil) when it comes to broad-based expertise and knowledge about the Norwegian shelf. The company also plays a key role as operator for many of the large, older fields on the shelf. It is extremely important for overall value creation that the company continues an active, effective and long-term commitment on the Norwegian continental shelf.

Today, there are many large and medium-sized companies with an active commitment on the Norwegian shelf, and there is still a combination of experienced and active large and medium-sized companies, more pure exploration companies and new companies within both exploration and production. This diversity and competition among the players in all parts of the value chain contributes to good resource utilisation and ensures continued interest in the opportunities that are found on the Norwegian shelf.

Production and exports

Norway is an important supplier of oil and gas to the global market, and almost all oil and gas produced on the Norwegian shelf is exported. About 95 per cent of Norwegian gas production is exported via pipelines directly to the EU and UK. Company and government revenues from sales of oil and gas have played a crucial role in creating modern Norwegian society.

Production forecasts

The Norwegian Offshore Directorate’s estimates indicate that oil and gas production is expected to reach a peak in 2025.

Status of production

In the 50 years since the start of Norway’s petroleum activities, about 55 per cent of the estimated total recoverable resources on the continental shelf is produced and sold. This indicates that there is also a potential for a high activity level on the shelf for the coming 50 years.

In 2023, Norway produced 233.2 million Sm³ of marketable oil equivalents (Sm³ o.e.), which is a slight increase compared with the production of 232.8 million Sm³ in 2022. By comparison, total production in the record year of 2004 was 264.2 million Sm³ o.e.

Oil production in 2023 was higher than in 2022. The main reason is startup of production from new projects. The gas production was five per cent lower in 2023 than in 2022. Total sales of gas amounted to 117.3 billion Sm³ (116 billion Sm³ 40 megajoules of gas). In 2023, natural gas accounted for 50 per cent of the total production measured in oil equivalents. The reason for the reduction is mainly extended maintenance activities on the onshore facilities.

Production forecasts

Historical production and production forecasts for the next five years split by product type are shown in the figure below.

Historical and expected production in Norway, 1970-2028

Updated: 20.02.2024

Source: Norwegian Offshore Directorate

Print illustration Download data Historical and expected production in Norway, 1970-2028 Download PDF Download as image (PNG)

High Contrast Mode

Historical and expected production in Norway, 1970-2028

The production profile of a typical oil field shows a rapid increase to a maximum production rate, then a stable period of production (the plateau phase) followed by a gradual decline in production. Without further investments, oil production will decline rapidly, and even with considerable investment to improve recovery, it can be difficult to maintain production from a field.

As a result of the high development activity on the Norwegian continental shelf, it is expected that the oil and gas production will be stable in the coming years. Without new fields or large-scale investments on existing fields, production from the shelf would decline. New fields that come on stream will in the short term compensate for lower production from aging fields.

The future production level over time is uncertain. It depends, for example, on which initiatives are implemented on the fields, discoveries that are decided to be developed, and when they come on stream. New discoveries in the future, how large they are, and how and when they are developed, will also affect the production level over time.

The figure below shows total historical production and production forecasts until 2033, distributed by maturity of the resources.

Production history and forecast distributed per resource category, 2019-2033

Updated: 20.02.2024

Source: Norwegian Offshore Directorate (Gas is normalised at 40 MJ)

Print illustration Download data Production history and forecast distributed per resource category, 2019-2033 Download PDF Download as image (PNG)

High Contrast Mode

Production history and forecast distributed per resource category, 2019-2033

Exports of oil and gas

Norway is a small player in the global crude market with production covering about 2 per cent of the global demand. Norwegian production of natural gas covers approximately 3 per cent of global demand, however, as an exporter Norway is a significant player. Norway is the third largest exporter of natural gas in the world, behind Russia and Qatar. In recent years, Norway has supplied between 20 and 25 per cent of the EU and United Kingdom gas demand. Nearly all oil and gas produced on the Norwegian shelf is exported. Combined, oil and gas exceeds half of the total value of Norwegian exports of goods. This makes oil and gas the most important export commodities in the Norwegian economy.

Oil and gas exports

Norway is an important supplier of oil and gas to the global market, and almost all oil and gas produced on the Norwegian shelf is exported. Company and government revenues from the sale of oil and gas have played a crucial role in creating the modern Norwegian society.

All licensees on the Norwegian shelf are responsible for selling the oil and gas they produce. The only exception is Equinor, which in addition is responsible for selling the government share of its oil and gas production (the SDFI share). This responsibility is set out in governmental instructions to Equinor.

Oil is a global commodity that is sold and delivered to most parts of the world. In contrast, there have historically been geographically separate regional gas markets. Gas markets have become more globalised as production and trade with liquefied natural gas (LNG) increase. About 95 % of Norwegian gas is transported via an extensive network of subsea pipelines to other European countries, while about 5 % is exported as LNG by ship from the Melkøya facility in Hammerfest.

What is produced on the Norwegian shelf?

The production from different reservoirs (the well stream) contains oil, gas and water in various combinations. To get marketable products, the production from the reservoirs must be separated and treated. The production from different reservoirs varies from oil with low gas content to almost dry gas (methane with only small amounts of other gases).

Crude oil is a fluid that is a combination of different types of hydrocarbons. The composition varies from field to field. The quality of the oil depends on several factors, for example how much and which substances, such as wax and sulphur, it contains. The composition also determines how light or heavy (viscous) the oil is.

Rich gas, or crude natural gas, is a mixture of various gases. When necessary, the gas is separated from the oil before the rich gas is treated in a processing facility that separates the dry and wet gas components. Dry gas is often referred to as natural gas, and consists mainly of methane, but also a little ethane.

Wet gas, or NGL (Natural Gas Liquids), consists of a mixture of heavier gases (ethane, propane, butane and naphtha). In addition there are heavier condensates which some classify as a separate product. Naphtha and condensate are liquid at room temperature, while the lighter wet gas components can be made liquid either by cooling or by adding pressure.

Not all gas that is produced is sold. Some of the gas is used to generate power on the fields, and small amounts are flared for safety purposes. On some fields, gas is reinjected into the reservoirs. Reinjection is often used to maintain reservoir pressure and displace the oil. This results in efficient recovery of the oil, and the gas is stored for possible recovery in the future.

Definition of Natural Gas, LPG and NGL

In addition to the export value of crude oil, natural gas, natural gas liquids (NGL) and condensate, the Norwegian service and supply industry has a high international turnover. You can read more about their exports of goods and services in the article about the service and supply industry.

The total export value of crude oil, natural gas, NGL and condensate in 2022 was about NOK 1 900 billion, or 73 % of the total value of Norway’s exports of goods. This is the highest value ever exported from Norwegian petroleum production In 2022, gas production accounted for a larger share of total export value compared to oil liquids (crude, NGL and condensate).

Export value of Norwegian petroleum, 1971-2022

Updated: 29.03.2023

The numbers are inflated with CPI Norway. 2022 are preliminary numbers.

Source: Statistics Norway, table 08800

Print illustration Download data Export value of Norwegian petroleum, 1971-2022 Download PDF Download as image (PNG)

High Contrast Mode

Export value of Norwegian petroleum, 1971-2022 – The numbers are inflated with CPI Norway. 2022 are preliminary numbers.

Exports of oil, condensate and NGL

Norwegian oil production reached a peak in 2001, when total liquid production, including NGL and condensate, was 3.4 million barrels of oil equivalents a day, and then declined by approximately 5 % on a yearly average until 2011. The production has since been more stable. In 2022, production of oil liquids (crude, NGL and condensate) was around 2 million barrels per day, and Norway now supplies about 2 % of global oil consumption.

In 2022, Norway exported about 80 million Sm³ (1,4 million barrels per day) of crude oil directly to other countries in Europe, and 9,1 million Sm³ (0,16 million barrels per day) was delivered to onshore facilities in Norway. 4,8 million Sm³ of crude oil was delivered to China in 2022. Crude oil purchasers are mainly refineries, which process the oil to produce fuel and other oil products.

The tables below show sales of crude, NGL and condensate in 2022 by first delivery point.

Norwegian oil deliveries in 2023, by first delivery point

Updated: 03.04.2024

Source: Norwegian Offshore Directorate

Print table Download data Norwegian oil deliveries in 2023, by first delivery point

Norwegian oil deliveries in 2023, by first delivery point

Sale of NGL and condensate in 2023, by first receiving country

Updated: 03.04.2024

Source: Norwegian Offshore Directorate

Print table Download data Sale of NGL and condensate in 2023, by first receiving country

Sale of NGL and condensate in 2023, by first receiving country

Crude oil exports 2022

Updated: 06.11.2023

Download as image (PNG)

Crude oil exports 2022
The oil market

In 2021, oil was the largest energy source globally, followed by coal and gas. Oil meets about 31 % of total world energy demand.

What is oil used for?

The transport sector consumes more oil than any other sector. The second largest sector in terms of oil consumption is the petrochemical industry, and manufacturing of plastics is the most important branch of this sector. The petrochemical industry also includes the manufacture of other oil-based products such as paints, cosmetics and textiles and so on. Moreover, oil is used as fuel in other energy-intensive industries such as iron, steel and cement production. Other main uses of oil is to generate electricity and heat, and as an input for asphalt.

Which countries produce oil?

The US was the largest oil producer in 2021, followed by Saudi Arabia and Russia. OPEC, the Organization of the Petroleum Exporting Countries, accounts for about 30 % of global crude oil production. However, several major oil producers, including Russia and the US, are not OPEC members.

What is crude oil used for?

Download as image (PNG)

Source: Ministry of Energy

Source: Ministry of Energy

Oil prices

The graph below shows the average annual oil prices (Brent) from 2015 - 2023. The spot price does not necessarily reflect achieved prices from sales of oil produced on the Norwegian shelf.

High Contrast Mode

Oil Price Brent, yearly average 2015-2023

Norway and the 10 largest oil producers in 2021

Updated: 17.10.2022

Source: BP Statistical Review of World Energy 2022

Print illustration Download data Norway and the 10 largest oil producers in 2021 Download PDF Download as image (PNG)

High Contrast Mode

Norway and the 10 largest oil producers in 2021

Transport of crude oil

The oil from the Norwegian continental shelf is either transported by ship or through pipelines to a final delivery point on land. See article about the pipeline system for more information about oil pipelines on the Norwegian shelf.

Oil is transported from many fields on the Norwegian shelf to the markets using shuttle tankers. These are specialized tankers that take on oil via offshore loading buoys on the oil fields. Oil platforms often have limited storage capacity, and regular calls by shuttle tankers are needed to avoid stoppages because of capacity problems. Shuttle tankers are usually used for relatively short transport distances, and most Norwegian oil is therefore delivered to destinations in north-western Europe.

Larger tankers are used to carry oil that is to be transported further, for example from Norway to Mediterranean countries, Asia or America. They do not carry oil directly from the offshore fields, but from onshore terminals, which are supplied either by shuttle tankers or by pipelines from the oil fields. Pipelines are used to transport oil from the Norwegian shelf to four onshore terminals: Sture, Mongstad and Kårstø in Norway, and Teesside in the UK.

Exports of natural gas

The value of Norwegian gas exports in 2022 were higher than the value of Norwegian oil exports (including NGL and condensate), as a result of exceptionally high gas prices. Domestic consumption of gas in Norway is very low, and nearly all the gas produced is exported.

An extensive network of subsea pipelines links Norway’s offshore gas fields and onshore terminals directly to other recipient countries in Europe. The total length of the Norwegian gas pipeline network is about 8 800 kilometres, which is roughly the distance from Oslo to Bangkok. See article about the pipeline system for more information about the gas pipelines on the Norwegian shelf.

In addition, liquified natural gas (LNG) is shipped out from the Snøhvit field off Hammerfest on LNG carriers. Approximately 5% of Norwegian gas exports is LNG.

What is liquefied natural gas?

Liquified natural gas, or LNG, is produced by cooling and pressurising natural gas to a liquid state. It is transported on dedicated LNG carriers.

The advantage of LNG is that transport does not require pipelines, and it can therefore be sold anywhere in the world. However, conversion to LNG and transport by LNG carrier is considerably more energy-intensive and expensive than pipeline transport.

At present, only gas from the Snøhvit field is converted to LNG on a large scale in Norway. Globally, the supply of LNG has been growing rapidly over the last decade. It has mainly been driven by developments in the United States and Australia, amongst others and increasing demand, primarily in Asia. The growth is expected to continue the coming years.

Arctic Princess at the LNG facility on Melkøya
Arctic Princess at the LNG facility on Melkøya. Photo: Harald Pettersen, Equinor (Statoil)

Norwegian gas exports maintained on a stable high level in 2022, and Norway exported about 122 billion Sm3 gas (not normalised to 40 MJ/Sm3), mainly to other countries in Europe. The gross energy content in the total volume of Norwegian sales gas corresponds to about nine times normal Norwegian electricity production

In much of Europe, gas is an important source of energy for heating homes and industrial buildings, gas is used for cooking, as feedstock in industrial processes and is used in gas-fired power plants to generate electricity. Norwegian gas provides between 20 and 25 % of the EU and United Kingdom gas demand and makes an important contribution to energy security in Europe.

Norwegian natural gas exports 2022

Updated: 06.11.2023

Download as image (PNG)

Natural gas exports 2022
Gas markets

How is natural gas used and what is driving growth in consumption?

Natural gas meets about 25 % of total world energy demand, and thus, like oil, plays a very important part in meeting global energy needs. Natural gas has accounted for almost one third of the world's energy consumption growth during the last decade, and the use of natural gas is expected to increase in the future as well. Natural gas is used mainly for heating homes and commercial buildings, cooking and power generation and in the petrochemical industry.

Many of the products we use every day, such as cell phones, makeup, sunglasses, computers, medications and fertilizers for agriculture are made with natural gas as a feedstock. Natural gas is transported by pipeline or is cooled and pressurised to produce LNG, which is transported on LNG carriers. Economic growth, the prices of alternative energy sources, weather, temperature, climate change adaptation and mitigation measures are all factors that influence gas demand.

Using gas instead of coal for power generation can yield considerable reductions in greenhouse gas emissions. Europe and the rest of the world use a lot of coal for power generation. In electricity production, gas emits approximately half as much CO2 as coal. Replacing coal with gas in power generation can be a good measure to quickly reduce greenhouse gas emissions and improve air quality.

Gas is also a good partner for intermittent renewable energy. Unlike hydroelectric power, other renewable energy sources such as sun and wind cannot be stored over time and are as such less flexible. In the absence of effective storage capability of energy, gas can produce power when the sun does not shine and the wind does not blow. As Europe is getting more and more intermittent renewable energy sources, the more Europe will need the kind of flexibility gas can provide in order to balance fluctuations in the energy supply and ensure that consumers have reliable power supply.

Gas exporting countries

Norway is the third largest gas exporter in the world (2021). Several of the world’s largest gas producers export little to other countries. When assessing the global gas market, it is therefore most important to consider which countries have the largest volumes available for export.

Gas prices

The graph below shows the average annual European gas prices (TTF) from 2015 - 2023. The spot price does not necessarily reflect achieved prices from sales of gas produced on the Norwegian shelf.

European gas price (TTF), yearly average 2015-2023

Updated: 21.02.2024

Source: Refinitiv

Print illustration Download data European gas price (TTF), yearly average 2015-2023 Download PDF Download as image (PNG)

High Contrast Mode

European gas price (TTF), yearly average 2015-2023

Norwegian net gas exports in 2021 compared to other gas exporting countries

Updated: 17.10.2022

Source: BP Statistical Review of World Energy 2022

Print illustration Download data Norwegian net gas exports in 2021 compared to other gas exporting countries Download PDF Download as image (PNG)

High Contrast Mode

Norwegian net gas exports in 2021 compared to other gas exporting countries

Only about 40 per cent of Norway’s estimated gas resources have been produced so far. The production level is expected to remain high for the next 10 years. If the most optimistic resource estimates prove to be correct, production figures will be higher than the current forecasts.

Expected volumes of sales gas from Norwegian fields (1995-2035)

Updated: 11.01.2024

Download as image (PNG)

Source: Norwegian Offshore Directorate

Expected volumes of sales gas from Norwegian fields, 1995-2035
Source: Norwegian Offshore Directorate


Most natural gas from Norway which is sold on the European market is delivered to gas receiving terminals in Germany, the UK, Belgium and France through the Norwegian gas pipeline network. The total length of the pipeline network is about 8 800 kilometres, which is roughly the distance from Oslo to Bangkok. Norwegian gas accounts for a large portion of the total gas consumption in these four gas receiving countries; however, much of the gas is transported further to other European countries.

Norwegian natural gas exports in 2013-2023 by first delivery point

Updated: 10.04.2024

Source: Norwegian Offshore Directorate / Gassco

Print illustration Download data Norwegian natural gas exports in 2013-2023 by first delivery point Download PDF Download as image (PNG)

High Contrast Mode

Norwegian natural gas exports in 2013-2023 by first delivery point

The oil and gas pipeline system

One of the main objectives for the authorities is to achieve the greatest possible value creation from the extraction of Norwegian petroleum resources. Efficient systems for transporting oil and gas from the fields are an important element of efforts to achieve this. Today, the total length of the Norwegian gas pipeline network is roughly similar to the distance from Oslo to Bangkok. In addition, several pipelines connect oil fields on the Norwegian continental shelf with onshore oil terminals.

Oil and gas produced from a field need to be transported to customers. On many oil fields, oil is loaded directly on to tankers (buoy-loading). In other cases, oil and gas are transported by pipeline to onshore facilities. Oil, wet gas and liquefied natural gas (LNG) are transferred to ships at onshore facilities, while dry gas is moved by pipeline to the UK and continental Europe.

Efficient transportation systems are required to achieve the greatest possible value creation from the extraction of Norwegian petroleum resources

In contrast to the oil and gas fields on the Norwegian shelf, where the companies themselves are responsible for the operations, the gas pipeline system is more directly controlled by the authorities. The reason for this is that the gas transport system is a natural monopoly and is central to Norwegian petroleum activities. An important consideration for the authorities is to ensure equal access to capacity in the system on the basis of companies' needs. Furthermore, the tariffs payable for access to the infrastructure must be reasonable. Another important consideration is to ensure that the Norwegian gas transport system operates efficiently, and that the system is developed to meet future needs.

The oil transport system is not as closely regulated as the gas transport infrastructure, mainly because transport is a less important part of the value chain for oil.

Pipelines on the Norwegian continental shelf

Updated: 22.09.2022

Download as image (PNG)

Source: Norwegian Offshore Directorate

What do we produce on the Norwegian shelf?

The production (well stream) from different reservoirs contains oil, gas and water in various combinations. To get marketable products, the production from the reservoirs must be separated and treated. The production from different reservoirs varies from oil with low gas content to almost dry gas (methane with only small amounts of other gases).

Crude oil is a fluid that is a combination of different types of hydrocarbons. The composition varies from field to field, and the quality of the oil, including how light or heavy (viscous) the oil is, depends on the composition of the hydrocarbons as well as the contents of other substances, such as wax and sulphur.

Rich gas, or crude natural gas, is a mixture of various gases. When necessary, the gas is separated from the oil before the rich gas is treated in a processing facility that separates the dry and wet gas components. Dry gas is often referred to as natural gas, and consists mainly of methane, but also a little ethane.

Wet gas, or NGL (Natural Gas Liquids), consists of a mixture of heavier gases (ethane, propane, butanes and naphtha). In addition there are heavier condensates which some classify as a separate product. Naphtha and condensate are liquid at room temperature, while the lighter wet gas components can be made liquid either by cooling or adding pressure.

Not all gas that is produced is sold. Some of the gas is used to generate power on the fields, and small amounts are flared for safety purposes. On some fields, gas is reinjected into the reservoirs. Reinjection is often used to maintain reservoir pressure and displace the oil. This results in efficient recovery of the oil, and the gas is stored for possible recovery in the future.

Definition of Natural Gas, LPG and NGL

Definition of natural gas, LPG and NGL

Gas pipelines

A characteristic feature of gas production is that major investments are needed in transport infrastructure. Norway’s first large pipelines were laid early in the 1970s, and since then the Norwegian gas transport system has been developed to meet ever-expanding needs (see Gassco’s interactive map of the transport system). From dedicated gas transport solutions for individual fields, it has been transformed into an integrated system serving most of the Norwegian continental shelf. This is a cost-effective and reliable way of transporting gas, and gives Norwegian gas a substantial competitive edge.

The transport capacity of the Norwegian pipeline network is currently about 120 billion Sm3 dry gas per year. Three onshore gas processing plants – Kårstø, Kollsnes and Nyhamna – are integrated with the pipeline network, and receive rich gas from the fields. Dry gas is separated from the rich gas for onward pipeline transport to receiving terminals abroad. There are four receiving terminals for Norwegian gas in continental Europe (two in Germany, one in Belgium and one in France) and a further two in the UK.

The total length of the Norwegian gas pipeline network is about 8 800 kilometres, which is roughly the distance from Oslo to Bangkok. Most of the gas transport infrastructure is jointly owned through the partnership Gassled, while Gassco is the neutral and independent operator.

Gas pipelines on the Norwegian continental shelf

Updated: 22.09.2022

Download as image (PNG)

Source: Norwegian Offshore Directorate

Gas pipelines on the Norwegian continental shelf

Updated: 19.03.2020

Source: Gassco AS, The Norwegian Ministry of Energy

Print table Download data Gas pipelines on the Norwegian continental shelf

Gas pipelines on the Norwegian continental shelf

Organisation of the gas pipeline transport system

The authorities play an important role in ensuring that processing and transport capacity is developed to meet future needs. It is also essential to ensure that the Norwegian gas transport system operates efficiently. The operator Gassco, the joint venture Gassled and regulated access to the transport system are important elements of the framework.

The gas transport system is governed by Chapter 9 of the Petroleum Act and Chapter 9 of the Petroleum Regulations.

The Norwegian gas transport infrastructure includes several receiving terminals in other countries. Norway and the countries where gas from the Norwegian shelf is landed have concluded agreements regulating their rights and obligations in this connection.

Picture from Kollsnes
Photo: Manfred Jarisch, Equinor (Statoil)

Gassco
Gassco was established in 2001, and is 100 % state-owned. Gassco is the neutral, independent operator of the gas transport system, and plays two different roles, often called ‘special operatorship’ and ‘normal operatorship’. Special operatorship means the responsibilities Gassco is directly assigned under the Petroleum Act and associated regulations. These include its role in developing new infrastructure, administering system capacity and coordinating and managing gas streams through the pipeline network to markets. Normal operatorship means running the infrastructure in accordance with the requirements of the Petroleum Act and the health, safety and environment legislation.

Gassco’s neutrality and independence as operator are intended to ensure that all users of the gas transport system are treated equally, and are also important when Gassco plans new infrastructure and gives advice to the authorities. As the system operator and the actor with the best overview of the system, Gassco has the task of further developing integrated Norwegian gas infrastructure. This means for example that when major development projects are being evaluated, other gas fields than those that have a clearly defined need for gas transport must also be taken into consideration. Interactions between new and existing infrastructure must also be part of the assessment.

Video: Gassco in two minutes


Gassled
Gassled is a joint venture that owns most of the gas infrastructure on and serving the Norwegian continental shelf: pipelines, platforms, onshore processing plants and receiving terminals abroad. Organisation as a joint venture means that it is possible to avoid conflicts of interest, for example when deciding which pipeline should be used to transport gas from a particular source. This ensures that gas is transported as efficiently as possible, thus helping to maximise value creation.

Gassled’s activities are regulated by the Petroleum Regulations, and tariffs for individual services are determined by the Ministry of Energy. Gassled has no employees, but a system of committees with specific tasks. The ownership in Gassled can be seen on Gassco's website.

Oil and condensate pipelines

Transport infrastructure makes up a smaller part of the value chain for oil than for gas. In many cases, oil is loaded directly on to tankers on the offshore fields. For some of the larger field developments in Norway, it was considered most appropriate to build onshore oil terminals. Other fields have subsequently been connected to this infrastructure.

Oil transport infrastructure on the Norwegian shelf is divided into four different systems. Oil pipelines from fields in the North Sea run to the Norwegian terminals Sture, Mongstad and Kårstø and to Teesside in the UK. At the Norwegian terminals, oil is stored in rock caverns before most of it is loaded on to tankers for export.

Oil pipelines on the Norwegian continental shelf

Updated: 19.03.2020

Download as image (PNG)

Source: Norwegian Offshore Directorate

Oil pipelines on the Norwegian continental shelf
Source: Norwegian Offshore Directorate

Oil and condensate pipelines on the Norwegian continental shelf

Updated: 19.03.2020

Source: Gassco AS, The Norwegian Ministry of Energy

Print table Download data Oil and condensate pipelines on the Norwegian continental shelf

Oil and condensate pipelines on the Norwegian continental shelf

Organisation of the oil pipeline transport system

The oil transport system is not as closely regulated as the gas transport infrastructure, mainly because transport is a less important part of the value chain for oil. The cost of transport is lower in relation to the product price, and buoy-loading directly on to tankers on the oil fields is an alternative to using pipelines and terminals. There is no single integrated system of oil pipelines and terminals: the infrastructure is divided into four different systems connected to the terminals at Sture, Mongstad and Kårstø in Norway and Teesside in the UK.

The owners and users negotiate agreements on access to oil transport infrastructure between themselves. Like negotiations on the use of infrastructure on the fields, these negotiations are governed by the Regulations relating to the use of facilities by others.

Regulation of access to the pipeline system

The gas transport system is a natural monopoly, requiring substantial infrastructure investments in the development phase. Access to the system and tariffs for its use are therefore regulated by the authorities through chapter 9 in the "Regulations to Act relating to petroleum activities" and the "Regulations relating to the stipulation of tariffs etc. for certain facilities".

To promote sound resource management, the tariffs are set such that returns from oil and gas production are mainly derived from the producing fields, while at the same time providing a reasonable return on investment for the infrastructure owners. This avoids a situation where development projects for fields and discoveries that are profitable for society are not commercially viable because the cost of using the transport system is too high. The petroleum companies are given access to capacity in the system on the basis of their needs. To provide flexibility, the users are allowed to exchange transport rights if their needs change.

Pipelaying on the Ekofisk field

Download as image (PNG)

Photo: Kjetil Alsvik - ConocoPhillips

Pipelaying on the Ekofisk field
Photo: Kjetil Alsvik - ConocoPhillips

Onshore facilities

Norway has a number of onshore facilities linked to fields and pipelines on the Norwegian shelf, from Kårstø in the south to Melkøya in the north. They meet current needs for transport, storage and processing of oil and gas from the fields they serve.

Kollsnes gas processing plant

Øygarden municipality, Vestland

Kollsnes receives rich gas, which is separated into dry gas and NGL. The gas is dewatered and compressed, then transported by pipeline via the Sleipner and Draupner platforms to continental Europe. The processing plant has a capacity of up to 143 million Sm3 rich gas per day. The export capacity is 143 million Sm3 dry gas per day or about 2.2 million tonnes NGL per year. NGL is transported to Mongstad via the Vestprosess pipeline.


Picture of the av gas processing plant at Kollsnes
Picture of the av gas processing plant at Kollsnes (Photo: Øyvind Sætre - Gassco)

Kårstø gas and condensate processing plant

Tysvær municipality, Rogaland

Kårstø receives rich gas and unstabilised condensate (light oil), which are separated into liquid products and dry gas. The dry gas is transported by pipeline to continental Europe. The liquid stream is separated into six different products and is shipped out on special carriers. The plant has a capacity of about 95 million Sm³ rich gas per day, 6.3 million tonnes wet gas per year and about 4.5 million tonnes condensate per year.

Picture of the gas and condensate processing plant at Kårstø
Picture of the gas and condensate processing plant at Kårstø (Photo: Øyvind Hagen -Gassco)

Melkøya LNG

Hammerfest municipality, Troms and Finnmark

The unprocessed well stream from Snøhvit is transported through a 143-kilometre-long pipeline to the Melkøya facility for processing and shipping. Onshore, the condensate, water and CO2 are separated from the wellstream before the natural gas is chilled to liquid form (LNG) and stored in dedicated tanks. The pipeline capacity is 7.7 million Sm3 per year. The CO2 separated from the natural gas is returned to the Snøhvit field where it is injected into a formation below the oil and gas reservoirs.

Picture of the LNG plant at Melkøya
Picture of the LNG plant at Melkøya (Photo: Øyvind Hagen-Gassco)

Mongstad oil terminal

Alver and Austrheim municipalities, Vestland

Mongstad receives and handles crude oil delivered by tanker from a number of fields, including Gullfaks, Statfjord, Draugen, Norne, Åsgard and Heidrun, and is also the terminal for the oil pipelines from Troll B, Troll C, Fram, Kvitebjørn, Valemon, Gjøa and Vega. Mongstad has three jetties that can be used by vessels of up to 400 000 tonnes, and six rock caverns with a total capacity of 1.5 million Sm3 crude oil. The Mongstad site also houses the Mongstad refinery, a combined heat and power plant and the Technology Centre Mongstad (TCM), the world’s largest facility for testing and improving CO2 capture technologies.

Picture of the Mongstad refinery
Picture of the refinery at Mongstad. Photo: Øyvind Hagen, Equinor (Statoil)

Nyhamna gas processing plant

Aukra municipality, Møre og Romsdal

The processing plant for gas from Ormen Lange is a conventional facility for dewatering, compression, gas export, separation of condensate, stabilisation, storage and fiscal metering of gas and condensate. The plant was later expanded to be able to receive rich gas from the Polarled pipeline. The pipeline transports gas from the Aasta Hansteen and Dvalin fields, and possible future field developments in the area.


Picture of the gas processing plant at Nyhamna
Picture of the gas processing plant at Nyhamna (Photo: Alice Berfall)

Gas plant expansion at Nyhamna

Gas plant expansion at Nyhamna

Sture terminal

Øygarden municipality, Vestland

Oil and condensate from the fields Oseberg, Veslefrikk, Brage, Oseberg Sør, Oseberg Øst, Tune and Huldra arrive at the Sture terminal via a pipeline from Oseberg A. The terminal also receives oil from the fields Grane, Svalin, Edvard Grieg and Ivar Aasen through the Grane oil pipeline.

The Sture facility includes two jetties that can berth oil tankers up to 300 000 tonnes, five caverns for crude oil storage with a total capacity of 1 million Sm3, one LPG cavern with a capacity of 60 000 Sm3, and a ballast water cavern of 200 000 m3. A fractionation plant processes unstabilised crude from the Oseberg field into stable crude oil and LPG blend.

Picture of the Sture terminal
Picture of the terminal at Sture. Photo: Øyvind Hagen, Equinor (Statoil)

Tjeldbergodden methanol plant

Aure municipality, Møre og Romsdal

The plant receives gas through the Haltenpipe system totalling about 0.7 billion Sm3 a year. This yields 830 000 tonnes of methanol. The Tjeldbergodden complex also includes an air separation plant. In addition, the company Tjeldbergodden Luftgassfabrikk DA operates a small fractionation and LNG plant with a capacity of 35 million Sm3 per year.

Picture of the methanol plant at Tjeldbergodden
Picture of the methanol plant at Tjeldbergodden. Photo: Harald Pettersen, Equinor (Statoil)

Vestprosess

Alver municipality, Vestland

Unstabilised NGL is transported by a 56-kilometre pipeline from the Kollsnes plant via the Sture oil terminal to Mongstad, where it is processed. The first step is separation of naphtha and LPG. Naphtha is used as a raw material in the refinery, and LPG is fractionated in a separate plant. The fractionation products, propane and butane, are stored in caverns for subsequent export.

Onshore facilities in Norway

Download as image (PNG)

Source: The Norwegian Offshore Directorate

Onshore facilities in Norway
Source: Norwegian Offshore Directorate

Economy

The oil and gas sector is Norway's largest measured in terms of value added, government revenues, investments and export value. The sector therefor plays a vital role in the Norwegian economy and the financing of the Norwegian welfare state.
Ormen Lange - Nyhamna

The government's revenues

The government’s total net cash flow from the petroleum industry is estimated to be NOK 986 billion in 2023 and NOK 832 billion in 2024. The estimate for 2023 is NOK 299 billion lower compared to the net cash flow in 2022.

When the first production licences were awarded in the mid-1960s, hardly anyone realised what the industry would mean for the Norwegian economy. Fifty years later, it is more important than ever.

The industry plays a vital role in the Norwegian economy and the financing of the Norwegian welfare state. The oil and gas sector is Norway's largest measured in terms of value added, government revenues, investments and export value. Long-term perspective in the management of the government's petroleum revenues ensures that they benefit Norwegian society as a whole, and that future generations will benefit from Norway’s petroleum wealth. This has been a key principle in developing the financial and legal framework for the sector.

Since production started on the Norwegian continental shelf in the early 1970s, petroleum activities have contributed to over NOK 22 000 billion in current NOK to Norway’s GDP. This does not include related service and supply industries. Yet so far, only about half of the estimated recoverable resources on the Norwegian shelf have been produced and sold.

Macroeconomic indicators for the petroleum sector, 2024

Updated: 06.10.2023

Download as image (PNG)

The service and supply industry is not included (Source: Ministry of Finance )

Macroeconomic indicators for the petroleum sector
Source: Ministry of Finance

One of the overall principles of Norway’s management of its petroleum resources is that exploration, development and production must result in maximum value creation for society, and that revenues must accrue to the Norwegian state and thus benefit society as a whole. The main reason for this is the extraordinary returns that can be obtained by producing petroleum resources. Since these resources belong to society as a whole, the Norwegian state secures a large share of the value creation through taxation and the system known as the State’s Direct Financial Interest (SDFI) in the petroleum industry.

The expected net government cash flow from petroleum activities (billion NOK, nominal values)

2023 2024
Taxes 613,5 482,3
Environmental taxes and area fees 8,9 9,3
Net cash flow from SDFI 287,4 302,3
Equinor dividend 76,6 38,3
Net government cashflow 986,4 832,2

(Source: Ministry of Finance, Prop. 30 S (2023-2024) and National Budget 2024)

The total payment form tax revenues and fees from petroleum activities are estimated to NOK 492 billion in 2024. The net cash flow from direct ownership in fields through the SFDI system is estimated to around NOK 302 billion. The government has additional income from Equinor dividend at around NOK 38 billion in 2024. Estimated total net cash flow from the petroleum industry in 2024 is NOK 832 billion.

The net government cash flow from petroleum activities, 1971-2022

Updated: 06.10.2023

Realised net government cash flow. Paid taxes are adjusted for repayments, and the numbers are in constant 2024-prices.

Source: Ministry of Finance, Statistics Norway

Print illustration Download data The net government cash flow from petroleum activities, 1971-2022 Download PDF Download as image (PNG)

High Contrast Mode

The net government cash flow from petroleum activities, 1971-2022 – Realised net government cash flow. Paid taxes are adjusted for repayments, and the numbers are in constant 2024-prices.

Government revenues from petroleum activities are transferred to the Government Pension Fund Global, which at the end of 2023 had holdings with a total value of around NOK 15 800 billion. Under the fiscal rule, transfers can be made to the fiscal budget from the Fund to finance important public goods without drawing on the Fund’s capital.

The oil and gas sector is Norway's largest measured in terms of value added, government revenues, investments and export value

Macroeconomic indicators for the petroleum sector, 1971-2024

Updated: 06.10.2023

2023 and 2024 are preliminary numbers from the National Budget 2024.

Source: Statistics Norway (National accounts), Ministry of Finance (National Budget 2024)

Print illustration Download data Macroeconomic indicators for the petroleum sector, 1971-2024 Download PDF Download as image (PNG)

High Contrast Mode

Macroeconomic indicators for the petroleum sector, 1971-2024 – 2023 and 2024 are preliminary numbers from the National Budget 2024.

Tax revenues

The petroleum taxation system is based on the rules for ordinary company taxation and are set out in the Petroleum Taxation Act (Act of 13 June 1975 No. 35 relating to the taxation of subsea petroleum deposits, etc). Because of the extraordinary returns on production of petroleum resources, the oil companies are subject to an additional special tax. The current ordinary company tax rate is 22 %. To ensure a neutral taxation system, paid company tax is written off when calculating the special tax base. This entails a special tax rate of 71,8 % in order to maintain a combined marginal tax rate of 78 %. In 2024, Norway’s tax revenues from petroleum activities is estimated to NOK 482,3 billion.

See article about the petroleum tax system for more information.

The State’s Direct Financial Interest

The State’s Direct Financial Interest (SDFI) is a system under which the Norwegian state owns holdings in a number of oil and gas fields, pipelines and onshore facilities. For oil and gas fields, the proportion is determined when production licences are awarded, and varies from field to field. As one of several owners, the government covers its share of investments and costs, and receives a corresponding share of the income from production licences.

The SDFI system was established on 1 January 1985. Before this, the Norwegian government only had ownership interests in production licences through Equinor (Statoil). From 1985, these were split in two: one part became the State’s Direct Financial Interest (SDFI) and the other part remained with Equinor.

When Equinor was listed on the stock exchange in 2001, the responsibility for managing the SDFI portfolio was transferred from Equinor to a new state-owned management company, Petoro. At the end of 2023 the SDFI portfolio consisted of financial interests in 175 production licences, 43 producing fields and holdings in 16 joint ventures that own pipelines and onshore facilities.

Net cash flow from SDFI in 2024 is estimated to around NOK 302,3 billion.

Oseberg A
Oseberg A platform. Photo: Harald Pettersen, Equinor (Statoil)

Revenue from direct state ownership in Equinor

The Norwegian state owns 67 % of the shares in Equinor, and receives dividends in the same way as other shareholders. In 2024, expected dividend paid to the state is around NOK 38,3 billion.

Area fees and environmental taxes

Area fees

The area fee is intended to ensure that awarded acreage is explored efficiently. In 2024, a total of NOK 1.5 billion is expected paid in area fees.

Environmental taxes

The carbon tax and the NOx tax are important environmental taxes in the petroleum sector. The petroleum industry is also included in the emissions trading system. Companies that are licensees on the Norwegian shelf must therefore purchase emission allowances if their greenhouse gas emissions exceed their allocated amount for the year.

Norway was one of the first countries in the world to introduce a carbon tax, in 1991. This is levied on all combustion of gas, oil and diesel in petroleum operations on the continental shelf and on releases of CO2 and natural gas, in accordance with the CO2 Tax Act on Petroleum Activities. For 2023, the tax rate is estimated to NOK 1.78 per standard cubic metre of gas and NOK 2,03 per litre of oil or condensate. For combustion of natural gas, this is equivalent to NOK 761 per tonne of CO2. For emissions of natural gas, the tax rate is NOK 13,67 per standard cubic metre.

The expected total tax levied is NOK 7,8 billion in 2024.

See article about emissions to air from petroleum activities for more information.

Management of revenues

The Government Pension Fund Global, originally called the Government Petroleum Fund, was established in 1990 to ensure a long-term perspective in the management of government petroleum revenues. At the end of 2023, the fund’s market value was about NOK 15 800 billion. This corresponds to just under NOK 3 million per registered person in Norway.

The Ministry of Finance made the first capital transfer to the fund in 1996. Since then, the government’s net cash flow from petroleum activities has been transferred to the fund each year. The sovereign wealth fund has a long investment horizon, and is among other things intended to be managed so that Norway’s petroleum wealth benefits future generations as well.

It was a net inflow of NOK 700 bn. to the funds capital from the government in 2023. This implies that the transactions from the fund over the government budget was smaller than net cash flow from the petroleum sector that was added to the fund during the course of the year. Before 2020, only in 2016 and 2017 did we see net outflow from the fund.

The sovereign wealth fund is intended to be managed so that Norway’s petroleum wealth benefits future generations as well

At the end of 2023, the fund’s market value was about NOK 15 800 billion. This corresponds to more than three times of Norway’s GDP and just under NOK 3 million per registered person in Norway. Since the start, the fund has received a net inflow of NOK 4 698 billion from petroleum activities after accounting for outflow to the State budget and management costs. The cumulative return from investments in equities, fixed income bonds and real estate was NOK 8 592 billion at year end 2023. The remaining market value of the fund is a result of foreign exchange gains.

Since the first capital transfer to the Government Petroleum Fund in 1996, the state's net cash flow from petroleum activities up to 2023 has been around 11 000 billion 2024-NOK.

The market value of the Government Pension Fund Global, 1996-2023

Updated: 29.02.2024

Source: Statistics Norway, NBIM

Print illustration Download data The market value of the Government Pension Fund Global, 1996-2023 Download PDF Download as image (PNG)

High Contrast Mode

The market value of the Government Pension Fund Global, 1996-2023

Petroleum revenues are phased into the economy gradually in accordance with the fiscal rule that over time, government spending must not use any of the fund’s capital, only its expected real return – currently estimated to 3 %. The fiscal rule also provides for petroleum revenue spending to be increased in economic downturns and decreased in economic upturns.

This ensures that petroleum revenues help to smooth fluctuations in the economy and ensure good utilisation of capacity and low unemployment. It contributes to economic stability and predictability, which is very important for decision-makers and for society as a whole. Provided that the fiscal rule is followed, the fund’s capital will not be depleted over time, and future generations will also be able to benefit from Norway’s petroleum wealth.

Video: The Fund- history, objective and management

The petroleum tax system

The overall objective of Norway’s petroleum policy has always been to provide a framework for profitable production of oil and gas in a long-term perspective. It has also been considered important to ensure that a large share of the value creation accrues to the state, so that it can benefit society as a whole. This is partly obtained by the tax system.

The petroleum taxation system is based on the rules for ordinary company taxation and are set out in the Petroleum Taxation Act (Act of 13 June 1975 No. 35 relating to the taxation of subsea petroleum deposits, etc). Because of the extraordinary returns from production of petroleum resources, the oil companies are subject to an additional special tax. The ordinary company tax rate is 22 %. To ensure a neutral taxation system, paid company tax is written off when calculating the special tax base. This entails a special tax rate of 71,8 % in order to maintain a combined marginal tax rate of 78 %.

Total estimated tax payments from petroleum activities are about NOK 597 billion in 2023. Norway’s tax revenues from petroleum activities between 1971 and 2022 is shown below.

The net government cash flow from petroleum activities, 1971-2022

Updated: 06.10.2023

Realised net government cash flow. Paid taxes are adjusted for repayments, and the numbers are in constant 2024-prices.

Source: Ministry of Finance, Statistics Norway

Print illustration Download data The net government cash flow from petroleum activities, 1971-2022 Download PDF Download as image (PNG)

High Contrast Mode

The net government cash flow from petroleum activities, 1971-2022 – Realised net government cash flow. Paid taxes are adjusted for repayments, and the numbers are in constant 2024-prices.

Neutral tax system

The petroleum taxation system is intended to be neutral, so that an investment project that is profitable for an investor before tax is also profitable after tax. This ensures substantial revenues for the Norwegian society and at the same time encourages companies to carry out all profitable projects.

To ensure a neutral tax system, only the company's net profit is taxable, and losses may be carried forward in the company tax. Special tax value of losses is reimbursed at the tax settlement, the year after it accrued. Neutral properties in the tax system are also important when defining investment based tax deductions.

The petroleum taxation system is intended to be neutral, so that an investment project that is profitable before tax is also profitable after tax

Net profit

In general, only the company's net profit is taxable. Exemptions, such as royalties, are no longer a part of the tax system. Deductions are allowed for all relevant costs, including costs associated with exploration, research and development, financing (ordinary tax), operations and decommissioning.

Consolidation between fields is allowed. This means that losses from one field, or exploration costs, can be written off against the company's income from operations elsewhere on the Norwegian continental shelf.

Cash-flow model in the special petroleum tax

As of the income year 2022, a cash-flow based tax was introduced in the special tax. This means that investments are deducted immediately in the special tax base. To ensure a completely neutral special tax, a deduction is also made for the calculated ordinary company tax in the special tax base. In order to maintain a combined marginal tax rate of 78 per cent, the special tax rate was technically increased from 56 to 71.8 per cent. Financing costs are not deductible in the special tax base.

Loss carry forward and reimbursement

Companies that do not have any taxable income may carry forward losses to subsequent years in the company tax. The special tax value of the deficit is reimbursed. These rules are intended to ensure that companies are treated equally for tax purposes regardless of whether or not a company is liable to pay tax.

Investment based deductions

When the basis for ordinary tax is calculated, investments are written off using straight-line depreciation over six years starting from the year the expense incurred. In the special tax base, investments are written off immediately in line with a cash-flow based taxation model.

Norm pricing

In many instances, petroleum produced by companies operating on the Norwegian continental shelf is sold to affiliated companies. It is important for the Norwegian government revenues that oil and gas sold from Norway is taxed on the basis of market prices. To assess whether the prices agreed by affiliated companies are comparable to those that would have been agreed by two independent parties, the authorities can set norm prices that must be used when calculating taxable income for the tax assessment.

The Petroleum Price Council is responsible for setting norm prices, which it does after collecting information from the companies and holding meetings with them. The norm price system applies to various types and qualities of petroleum. For gas, the actual sales prices are used.

Norm prices back to 2012 are available here: Petroleum Price Board and the norm prices - regjeringen.no. Earlier norm prices can be found in the governments historical archive.

Calculation of petroleum tax:


Ordinary corporate tax Special tax
Operating income (norm prices for oil) Operating income (norm prices for oil)
   - Operating expenses    - Operating expenses
   - Linear depreciation for investments (6 years)    - Depreciation for investments (100 %)
   - Exploration expenses, R&D and decom.    - Exploration expenses, R&D and decom.
   - Environmental taxes and area fees    - Environmental taxes and area fees
   - Net financial costs    - Calculated ordinary tax
   - (Loss carry forward)
= Corporation tax base (22 %) = Special tax base (71,8 %)
Temporary changes in the petroleum tax system

In the first half of 2020 the global oil demand fell dramatically because of the Covid-19 pandemic. The pandemic, combined with low oil and gas prices, resulted in temporary financial difficulties and increased uncertainty. Without temporary tax changes, the investment activity on the Norwegian continental shelf could have been lower than expected as a consequence of postponed of planned and profitable projects. This could have led to problems for the service and supply industry.

In June 2020, the Norwegian parliament enacted temporary changes in the petroleum tax act to help oil and gas companies execute planned investments. The decision changes rules for depreciation and uplift, as well as the treatment of tax losses, for a limited period of time:

  • Full depreciation, plus 24 per cent uplift, in the investment year, in the special tax base. Applies to all investments in 2020 and 2021, and investments until planned start of production under development plans delivered to the authorities before 1 Jan 2023 and approved before 1 jan 2024.
  • Companies with tax losses in 2020 and 2021 can get the losses refunded.
  • In the transition to a cash flow tax, the uplift in the temporary rules was set at 17,69 per cent (adjusted down from 24 per cent due to a technical rate increase in the special tax).
  • For the 2023 National Budget, the uplift was further reduced to 12,4 per cent.

Investments and operating costs

In 2023, the authorities have approved several plans for new field developments and several amended plans for the further development of fields in operation to increase recovery and/or extend their lifetime.

Major investments have been made in exploration, field development, transport infrastructure and onshore facilities since petroleum activities started on the Norwegian continental shelf. Fields that are on stream also continue to require a substantial level of investment. Much of the Norwegian shelf is now served by an extensive network of installations and pipelines tied into onshore facilities. New discoveries can be tied back to this infrastructure. This will encourage a high level of activity and effective exploitation of resources on the shelf in the years ahead.

The oil companies and the supply industry have worked hard to improve profitability by operating more efficiently and reducing costs. This makes new projects profitable even if oil prices are low.

The cost estimates below are based on assumptions about oil price developments, cost trends and investment decisions by oil companies. The estimated figures are therefore considerably uncertain, and the uncertainty increases over time.

Johan Sverdrup field (phase 1)
Concept drawing of the Johan Sverdrup field (phase 1). Illustration: Equinor

Overall costs

The high level of investments and exploration activity, combined with rising operating costs, resulted in record overall costs on the Norwegian continental shelf in 2014. Developments after 2014 have led to a considerable reduction in total costs, but the activity level today is historically high.

The figure below shows historical figures and estimates for the Norwegian shelf for investments, costs for field operation, exploration, decommissioning and disposal, as well as other costs. In 2022, the overall costs were around NOK 300 billion. Investments made up about 55 per cent of this, operating costs 30 per cent, and exploration costs about eight per cent. Total costs are expected to increase in real terms by ten per cent in 2023 and by further seven per cent in 2024. The increase in total costs towards 2024 is largely related to increased investments due to investment decisions taken for several projects in the autumn of 2022. From 2025, a decrease in total costs is expected.

Overall costs by category

Updated: 11.01.2024

Historical figures for 2011-2022 and forecast for 2023-2028

Source: Norwegian Offshore Directorate

Print illustration Download data Overall costs by category Download PDF Download as image (PNG)

High Contrast Mode

Overall costs by category – Historical figures for 2011-2022 and forecast for 2023-2028

Exploration costs

Exploration costs include costs related to seismic data acquisition to map potential petroleum deposits under the seabed and related to drilling exploration wells. Exploration wells are divided into two types, wildcat wells and appraisal wells. Wildcat wells are drilled to find out whether there are hydrocarbons below the seabed. When a discovery has been made, appraisal wells may be drilled to obtain more data about the size and extent of the discovery.

In 2023, exploration costs on the Norwegian shelf amounted to NOK 26 billion. A total of 33 exploration wells were completed, 21 of which were wildcat wells and 12 were appraisal wells. Exploration drilling resulted in 15 discoveries in 2023.

Exploration costs and number of exploration wells

Updated: 11.01.2024

Historical figures for 2011-2022 and forecast for 2023-2028

Source: Norwegian Offshore Directorate

Print illustration Download data Exploration costs and number of exploration wells Download PDF Download as image (PNG)

High Contrast Mode

Exploration costs and number of exploration wells – Historical figures for 2011-2022 and forecast for 2023-2028

Investments

Major investments have been made in field development, infrastructure and onshore facilities in Norway, and the development plans submitted to the authorities in 2022 will contribute to a continued high level of activity in the coming years. At the same time, substantial investments are being made in producing fields to improve recovery and extend the lifetime of the fields. This requires new wells, modification of existing facilities and new infrastructure. Total investments, excluding exploration, were NOK 158 billion in 2022 and are estimated to be NOK 201 billion in 2023. Total investments are expected to increase to NOK 207 billion in 2024.

The overall investments in the petroleum sector (including exploration and decommissioning costs) account for about one-sixth of total investments in production capital in Norway. This is far more than for any other industry in Norway. Even the smaller offshore projects are comparable to the largest industrial investments on mainland Norway.

Investments in the petroleum sector account for about one-sixth of total investments in production capital in Norway

In 2023, one plan for a new field development has been submitted. It deals with the development of the Eirin gas discovery, which is planned to be tied-back to Gina Krog. No investment decisions have been made on fields in operation that required submission of a new development plan to the authorities in 2023.

Several larger projects on fields in operation, as well as new field developments, contribute to a relatively stable activity level for the next few years.

Investments distributed on field status

Updated: 11.01.2024

Historical figures for 2011-2022 and forecast for 2023-2028

Source: Norwegian Offshore Directorate

Print illustration Download data Investments distributed on field status Download PDF Download as image (PNG)

High Contrast Mode

Investments distributed on field status – Historical figures for 2011-2022 and forecast for 2023-2028

Investments by main category

Updated: 11.01.2024

Historical figures for 2011-2022 and forecast for 2023-2028

Source: Norwegian Offshore Directorate

Print illustration Download data Investments by main category Download PDF Download as image (PNG)

High Contrast Mode

Investments by main category – Historical figures for 2011-2022 and forecast for 2023-2028

Operating costs

The main operating costs on the Norwegian shelf are those related to the maintenance of platforms and wells, as well as costs for daily operation of the facilities. These include labour costs for all personnel who perform modifications and maintenance of machinery and other equipment. This work is essential if costly production downtime is to be avoided.

At the end of 2023, 92 fields on the Norwegian continental shelf were producing oil and gas, and the total operating costs for the year were close to NOK 85 billion. The operating companies are engaged in efforts to reduce the operating costs; however, increased costs for power contribute to somewhat higher costs.

Operating costs distributed on field status

Updated: 11.01.2024

Historical figures for 2011-2022 and forecast for 2023-2028

Source: Norwegian Offshore Directorate

Print illustration Download data Operating costs distributed on field status Download PDF Download as image (PNG)

High Contrast Mode

Operating costs distributed on field status – Historical figures for 2011-2022 and forecast for 2023-2028

Operating costs by main category

Updated: 11.01.2024

Historical figures for 2011-2022 and forecast for 2023-2028

Source: Norwegian Offshore Directorate

Print illustration Download data Operating costs by main category Download PDF Download as image (PNG)

High Contrast Mode

Operating costs by main category – Historical figures for 2011-2022 and forecast for 2023-2028

Transparency - EITI

To promote the disclosure of flows of taxes and fees in the petroleum and mining industries, Norway has implemented the EITI standard. This was established by the Extractive Industries Transparency Initiative as a global standard to promote transparency about the revenues countries receive from the extraction of natural resources.

Transparent and accountable resource management

The objective with the EITI-standards is to improve governance of the extractive industries through disclosure and oversight of government revenues from oil, gas and mining companies. This should in turn result in better management of natural resources and enable citizens to hold their governments to account for how the revenues are used.

56 countries are currently implementing the EITI standard. Norway was accepted as EITI compliant in March 2011, and was the first OECD country to implement the EITI standard. Norway is also the first country to mainstream EITI in government system and corporate reporting which mean Noray will no longer publish a separate EITI-report.  All relevant information is already available from other source, including www.norwegianpetroleum.no.  Further, Norway does not have an EITI specific stakeholder group.

For more information, see: Norway | EITI

EITI is an international initiative to promote transparency about the revenues countries receive from the extraction of natural resources

Net payments to the authorities in billion NOK, 2018 - 2022:

2018 2019 2020 2021 2022
237 236,6 94,6 277,5 1 249,1

(Source: The Norwegian Tax Administration, Petoro, The Norwegian Offshore Directorate)


The table below shows the cash flows reported by the Norwegian authorities received from offshore companies in 2022, in nominal billion NOK.

Please download data for further details on the composition of taxes and fees in the time period 2018 - 2022 (nominal values). Figures does not include dividends from direct state ownership in Equinor.

Net payments to the authorities in billion NOK, 2022

Updated: 20.12.2023

Source: The Norwegian Tax Administration, Petoro, The Norwegian Offshore Directorate

Print table Download data Net payments to the authorities in billion NOK, 2022

Net payments to the authorities in billion NOK, 2022

Environmental taxes in million NOK by fields, 2022

Updated: 20.12.2023

Source: The Norwegian Offshore Directorate

Print table Download data Environmental taxes in million NOK by fields, 2022

Environmental taxes in million NOK by fields, 2022


For Norwegian companies’ that have a duty to prepare annual accounts, information on payments to the government will appear in the company’s annual account. These are available on the company’s webpage and/or in the Brønnøysund Register Centre. Information on companies’ payments to the government shall be available on the companies’ webpages, in accordance with the Norwegian country-by-country-rules as laid down in the Act on Annual Accounts [regnskapsloven] § 3-3d and the Securities Trading Act [verdipapirhandelloven] § 5-5a with Regulation of the 20th of December 2013 no. 1682 on country-by-country-reporting (the CCB-regulations [LLR-forskriften, in Norwegian]). The report shall be published on the reporting entity’s webpage and shall be available for at least 5 years, cf. the CCB-regulations § 6. The annual statement of the company shall include information on where the report has been published, cf. the Act on Annual Accounts § 3‑3d first paragraph.

Employment in the petroleum industry

The oil and gas industry plays an integral part of the overall Norwegian employment rate. A significant proportion is employed either directly or indirectly in the petroleum sector in Norway. After a period where the oil and gas industry has streamlined their operations and adapted to a lower activity level, both domestically and globally, the number of employees has increased again in recent years. In 2021, approximately 200 000 people were directly or indirectly employed in the Norwegian petroleum sector.

Employment in the oil and gas industry dropped in 2015 after several years of strong growth. Since 2018, the number of employees in the petroleum industry has increased again. It is challenging to precisely estimate the number of people employed in the sector, because it is complicated to separate deliveries of petroleum-related goods and services and deliveries to other industries. Furthermore, it is even more complicated to estimate indirect employment. In other words, employment generated in other parts of the economy by demand from the petroleum industry.

In 2021, about 200 000 people in Norway were directly or indirectly employed in the petroleum sector

Direct and indirect employment

A study done by Statistics Norway estimated that around 156 100 people were directly or indirectly employed in the petroleum industry and petroleum-related industries in 2021. This figure corresponds to about 6 % of total employment in Norway. The figures are estimated by input-output analysis, and Statistics Norway describes this method in the report Spillover-effects from the offshore petroleum to the mainland economy. The level of employment associated with the petroleum sector has been revised downwards with 6 900 people from the previous report.

Employment related to the petroleum industry 2016 2017 2018 2019 2020 2021
Statisitcs Norway's report from 2018 173 200 170 200
Statistics Norway's report from 2019 139 500 139 900
Statistics Norway's report from 2020 148 000 158 400
Statistics Norway’s report from 2021 163 600 163 000
Statistics Norway’s report from 2022 156 900 156 100
Percentage of total employment 5,5 % 5,1 % 5,5 % 5,8 % 5,6%

Indirect employment is a result of demand from the petroleum industry for goods and services in a variety of sectors, including wholesale and retail, IT equipment and services, employment agencies, renting of machinery and equipment, hotel and restaurant and legal and accounting services. Statistics Norway's report only covers activity related to the Norwegian petroleum industry and does not include activity related to deliveries to petroleum activity in other countries. In addition, there are employees in export companies targeting the petroleum industry.

A similar report published by Menon Economics (2023), funded by the Ministry of Energy, showed that there were roughly 204 000 either directly or indirectly employed in the petroleum sector in Norway in 2021. The study includes number of employees who are linked to services and value creation that takes place directly on the Norwegian continental shelf, as well as the effects of exports from the offshore supply industry. The report estimates that 169 000 people were linked to services and value creation that takes place on the Norwegian continental shelf, while about 35 000 people can be tied to the effects of exports from the offshore supply industry.

Direct employment

The illustration below, based on data from National Budget (SSB), illustrates the direct employment in the oil and gas industry since the early 1970's. Employment in companies not fully targeted towards the upstream sector are not included in these figures. This incorporates the majority of the oil service and supply industry and explains the deviation from the employment figures above. From 1972 to 2014 the employment increased from 200 to 67 000. The illustration also captures the first ever drop in employment from 2014 to 2018. Since 2018, the number of employees has increased again and the estimate for direct employees in 2022 was around 60 000.

Number of employees in the Norwegian petroleum sector, 1970-2022

Updated: 06.10.2023

Source: Statistics Norway - Annual national accounts (table 09174)

Print illustration Download data Number of employees in the Norwegian petroleum sector, 1970-2022 Download PDF Download as image (PNG)

High Contrast Mode

Number of employees in the Norwegian petroleum sector, 1970-2022

Regional employment in the Norwegian oil and gas industry

Regional employment and local value creation have been long-standing objectives for Norwegian oil and gas policies. This has contributed to making Norway a global front-runner in a number of areas. Regional employment is especially high on in western parts of Norway, particularly in Rogaland and the Stavanger-region. As the shelf has matured and offshore activities have moved north, so has the activities onshore. Currently, world leading oil and gas clusters and a global competitive oil service industry exists in many parts of the country.

Lower activity and weaker demand from the petroleum industry, both in Norway and globally, had major impacts on the oil service and supply industry. Reducing staff costs and number of employees have been necessary to cut costs and adapt to the lower activity level. The greatest impact has been in western and southern Norway, where a higher proportion of total employment is linked to oil and gas activities.

The oil service and supply industry

Located throughout Norway, the industry employs a large share of people along the coastline. The petroleum sectors main seat is in the Stavanger region, where companies offering a wide range of goods and services are located. In other parts of the country, companies operating in the same market segment are clustered together based on regional expertise.

In and around Oslo is well-established engineering expertise and a cluster of seismic companies. Trondheim has a strong position in education, research and development, while the Bergen region has become a hub for platform maintenance and subsea equipment. In Buskerud, especially in Kongsberg, is a strong cluster focusing on subsea technology, automation and dynamic positioning equipment. Southern Norway is home to world-leading companies specializing in drilling technology. The Aalesund region has maritime companies who together make up a complete shipbuilding and outfitting cluster.

Bodø Science Park publish an annual report on the petroleum activity in the most northern counties; Nordland, Troms and Finnmark. The report concluded that 139 northern Norwegian companies had deliveries to the petroleum industry in 2022. Combined, these deliveries contributed to 2154 man-years.

Interactive map and quick downloads

Search and customise your own map or view and download tables, graphs, illustrations and maps used on this website.
Staff at Draugen platform

Interactive map

The Norwegian Offshore Directorate's fact maps are closely integrated with their fact pages, and they are updated on a daily basis. The fact maps contain information about wellbores, surveys, fields and discoveries, production licences, agreement-based areas, permanent facilities and more.

Illustrations and quick downloads

Maps, icons, illustrations, graphs and tables can be reused, given that the material is marked with the source and link to www.norskpetroleum.no. Photos used on the website are copy protected and cannot be reused without the photographer’s consent.

Facts

Valhall plattformene

Fields

A field is one or several discoveries combined which the licensees have decided to develop, and for which the authorities have approved a plan for development and operation (PDO) or granted a PDO exemption. Since production started in 1971, oil and gas have been produced from a total of 123 fields on the Norwegian shelf. At the end of 2023, 92 fields were in production: 67 in the North Sea, 23 in the Norwegian Sea and two in the Barents Sea. Four new field started production in 2023. A further fifteen new fields were under development at the end of the year. Many of the producing fields are ageing, but some of them still have substantial remaining reserves. Moreover, the resource base in these fields increases when small discoveries in the area are tied into existing infrastructure. Original and remaining reserves are given in million standard cubic metres of oil equivalents.

Discoveries

A discovery is a petroleum deposit or several petroleum deposits collectively, which have been discovered in the same well, in which through testing, sampling or logging there has been established a probability of the existence of mobile petroleum. The definition covers both commercial and technical discoveries. A discovery receives the status of a field, or becomes part of an existing field, when a plan for development and operation (PDO) is approved by the authorities or when an exemption from the PDO requirement has been granted. There are currently about 80 discoveries that could be, or are being, considered for development. Most of them are small and will be developed as satellites to existing fields. This will ensure that the infrastructure is used efficiently. Stand-alone development solutions are planned for the largest discoveries, but a number of smaller discoveries may also collaborate on building new infrastructure. Resource estimates are given in million Sm³ o.e.

Companies

A production licence is normally awarded to a group of companies headed by a designated operator. Including several companies in one licence enables less experienced companies to learn from those with more experience, and the different companies can control the operator’s activities and together ensure that the best possible decisions are made. At the end of 2023, a total of 27 companies were active on the Norwegian shelf, of which 20 were operators. The diversity of companies of all sizes promotes competition and efficiency. It also ensures interest in different types of projects, and implementation of different kinds of new and cost-effective technologies.

Historical production

In 2023, Norway produced 233 million standard cubic metres of oil equivalents (Sm³ o.e.) of marketable petroleum. By way of comparison, total production in 2023 was about 12 per cent lower than in the record year 2004 and at the same level as in 2022.

The production (well stream) from different reservoirs contains oil, gas and water in various combinations. To get marketable products, the production from the reservoirs must be separated and treated. The production from different reservoirs varies from oil with low gas content to almost dry gas (methane with only small amounts of other gases).

Crude oil is a fluid that is a combination of different types of hydrocarbons. The composition varies from field to field, and the quality of the oil, including how light or heavy (viscous) the oil is, depends on the composition of the hydrocarbons as well as the contents of other substances, such as wax and sulphur.

Rich gas, or crude natural gas, is a mixture of various gases. When necessary, the gas is separated from the oil before the rich gas is treated in a processing facility that separates the dry and wet gas components. Dry gas is often referred to as natural gas, and consists mainly of methane, but also a little ethane.

Wet gas, or NGL (Natural Gas Liquids), consists of a mixture of heavier gases (ethane, propane, butanes and naphtha). In addition there are heavier condensates which some classify as a separate product. Naphtha and condensate are liquid at room temperature, while the lighter wet gas components can be made liquid either by cooling or by adding pressure.

Definition of natural gas, LPG and NGL

Download as image (PNG)

Source: Ministry of Energy

Not all gas that is produced is sold. Some of the gas is used to generate power on the fields, and small amounts are flared for safety purposes. On some fields, gas is reinjected into the reservoirs. Reinjection is often used to maintain reservoir pressure and displace the oil. This results in efficient recovery of the oil, and the gas is stored for possible recovery in the future.

There is a delay of about two months in the production figures. Test production is not included in the production figures. All numbers below are in million Sm³ o.e., and natural gas is not normalised to 40 MJ/Sm3.

High Contrast Mode

Annual production

High Contrast Mode

Monthly production

Total production per sea area at year-end 2023

Source: Norwegian Offshore Directorate

Print table Download data Total production per sea area at year-end 2023

Total production per sea area at year-end 2023

Annual production from fields in the North Sea

Source: Norwegian Offshore Directorate

Print illustration Download data Annual production from fields in the North Sea Download PDF Download as image (PNG)

High Contrast Mode

Annual production from fields in the North Sea

Annual production from fields in the Norwegian Sea

Source: Norwegian Offshore Directorate

Print illustration Download data Annual production from fields in the Norwegian Sea Download PDF Download as image (PNG)

High Contrast Mode

Annual production from fields in the Norwegian Sea

Annual production from fields in the Barents Sea

Source: Norwegian Offshore Directorate

Print illustration Download data Annual production from fields in the Barents Sea Download PDF Download as image (PNG)

High Contrast Mode

Annual production from fields in the Barents Sea

Total production per field at year-end 2023

Source: Norwegian Offshore Directorate

Print table Download data Total production per field at year-end 2023

Total production per field at year-end 2023

Production per field in 2023

Source: Norwegian Offshore Directorate

Print table Download data Production per field in 2023

Production per field in 2023

Per company in 2023

Based on current ownership in fields

Source: Norwegian Offshore Directorate

Print table Download data Per company in 2023

Per company in 2023 – Based on current ownership in fields

Per operator in 2023

Based on current operatorships of fields

Source: Norwegian Offshore Directorate

Print table Download data Per operator in 2023

Per operator in 2023 – Based on current operatorships of fields

Remaining reserves

Remaining reserves comprise the remaining recoverable and marketable petroleum resources, which the licensees have decided to develop and for which the authorities have approved a plan for development and operation (PDO) or have granted exemption from the PDO requirement. The estimate is the difference between original reserves and sold/delivered volumes. In the resource classification system, remaining reserves include petroleum volumes in resource class 1, 2 and 3.

Remaining reserves per active field as of 31.12.2023

All measures in million standard cubic metres oil equivalents (million Sm³ o.e.)

Source: Norwegian Offshore Directorate

Print table Download data Remaining reserves per active field as of 31.12.2023

Remaining reserves per active field as of 31.12.2023 – All measures in million standard cubic metres oil equivalents (million Sm³ o.e.)

Remaining reserves per operator as of 31.12.2023

All measures in million standard cubic metres oil equivalents (million Sm³ o.e.)

Source: Norwegian Offshore Directorate

Print table Download data Remaining reserves per operator as of 31.12.2023

Remaining reserves per operator as of 31.12.2023 – All measures in million standard cubic metres oil equivalents (million Sm³ o.e.)

Remaining reserves per company as of 31.12.2023

All measures in million standard cubic metres oil equivalents (million Sm³ o.e.)

Source: Norwegian Offshore Directorate

Print table Download data Remaining reserves per company as of 31.12.2023

Remaining reserves per company as of 31.12.2023 – All measures in million standard cubic metres oil equivalents (million Sm³ o.e.)

Remaining reserves per area as of 31.12.2023

All measures in million standard cubic metres oil equivalents (million Sm³ o.e.)

Source: Norwegian Offshore Directorate

Print table Download data Remaining reserves per area as of 31.12.2023

Remaining reserves per area as of 31.12.2023 – All measures in million standard cubic metres oil equivalents (million Sm³ o.e.)

Original reserves

Original reserves comprise the total sold and recoverable petroleum resources, which the licensees have decided to develop according to current plans with an approved plan for development and operation (PDO) or a granted exemption from the PDO requirement. It also comprises petroleum resources which the licensees have decided to develop but the authorities have not yet approved a PDO or granted a PDO exemption for. In resource classification system, original reserves include petroleum volumes in resource class 0, 1, 2 and 3.

Original reserves per field

All measures in million standard cubic metres of oil equivalents (mill. Sm³ o.e.).

Source: Norwegian Offshore Directorate

Print table Download data Original reserves per field

Original reserves per field – All measures in million standard cubic metres of oil equivalents (mill. Sm³ o.e.).

Original reserves per sea area

All measures in million standard cubic metres of oil equivalents (mill. Sm³ o.e.).

Source: Norwegian Offshore Directorate

Print table Download data Original reserves per sea area

Original reserves per sea area – All measures in million standard cubic metres of oil equivalents (mill. Sm³ o.e.).

Resources per discovery

There are currently about 80 discoveries that could be, or are being, considered for development. Most of them are small and will be developed as satellites to established fields. Independent development is planned for the largest discoveries, but a number of smaller fields may also collaborate on building new infrastructure.

Resources per discovery

The Norwegian Offshore Directorate's current resource estimates are in million standard cubic metres of oil equivalents (mill. Sm³ o.e.)

Source: Norwegian Offshore Directorate

Print table Download data Resources per discovery

Resources per discovery – The Norwegian Offshore Directorate's current resource estimates are in million standard cubic metres of oil equivalents (mill. Sm³ o.e.)

Licences

A production licence gives a company or a group of companies a monopoly to perform investigations, exploration drilling and recovery of petroleum deposits within the geographical area stated in the licence. The licensees become owners of the petroleum that is produced. A production licence may cover one or more blocks or parts of blocks and regulates the rights and obligations of the participant companies with respect to the authorities. Production licences are awarded by the Ministry of Energy in numbered licensing rounds, or by yearly awards in predefined areas (APA). Transfer of a production licence or of a share of a production licence must be approved by the Ministry.

Exploration wells

Exploration wells are wells drilled to prove a possible deposit of petroleum or obtain information to delimit a discovered deposit. The term covers both wildcat and appraisal wells. The list contains active exploration wells on the Norwegian continental shelf (ongoing drilling activity).

Business areas

A business arrangement area (BAA) is an area which is a result of unitisation of production licences or other business arrangements which have changed the terms of the original production licence.